
Strategy & performance management platform
Turn strategy into results you can prove.
Qstrata links your vision, objectives, KPIs, OKRs, projects and risks in one place. Every result is submitted with evidence, checked and approved, so leaders act on figures they can trust.
- English and Arabic, with full right-to-left support
- Cloud or on-premise
- Built in Doha by

Product screens with sample data
Made for organisations that answer for results
Ministries and public authorities
Cascade national priorities to every department and report progress to leadership with evidence behind each figure.
Semi-government and state-owned companies
Align the corporate scorecard with shareholder targets, programmes and enterprise risk.
Private companies and groups
Run OKRs and KPIs across business units and subsidiaries, with one version of performance.
Strategy offices and PMOs
Replace spreadsheets and slide packs with one system for planning, tracking and reporting.
In the product today
Strategy lives in slides. Performance lives in spreadsheets.
Most organisations run their strategy through presentations, email threads and workbooks that nobody fully trusts.
Results arrive late and unverified
Figures are typed in, copied between files and rarely checked against evidence before they reach leadership.
No line of sight
Few people can show which priority a KPI serves, which projects move it, or which risks threaten it.
Reporting takes weeks
Every quarter, teams rebuild the same pack by hand, often in two languages.
Qstrata replaces all of this with one source of truth, from the vision down to each approved result.
From vision to verified evidence
Every figure on a dashboard can be traced down to the approved result, the evidence file and the person who signed it off.
- Vision
- Priorities
- Pillars
- Objectives
- KPIs & OKRs
- Initiatives
- Projects
- Milestones
- Approved results
- Evidence
- VisionVision 2030
- PillarCustomer centricity
- ObjectiveO-2.1 · Reliable public transport
KPI-2.1-01Methodology
One performance cycle, run the same way every period
Qstrata builds a proven management cycle into the system, so every unit plans, measures, verifies and reviews in the same rhythm.
- 1
Plan
Set the vision, priorities and pillars. Define objectives, KPIs, targets and weights, or start from the template library.
Strategy · KPI library - 2
Cascade
Push objectives down to sectors, departments, teams and people. Units can propose their own, and orphan checks catch gaps.
Cascade · OKRs - 3
Execute
Run initiatives, projects and milestones with budgets and owners, each linked to the KPIs it should move.
Portfolio - 4
Measure
Owners submit results with evidence each period, or connectors pull them from your systems on a schedule.
Results · Integrations - 5
Verify
Validators check the figure and the evidence and approvers sign off. Segregation of duties is enforced.
Workflow · Audit - 6
Review and act
Scores update on approval. Early warnings raise risks and corrective actions, and review packs go to leadership.
Dashboards · Reports · Actions
Framework
A framework that holds from vision to evidence
Every level is linked to the one above it. Weights roll scores up, and risk, quality and data governance cut across the whole structure.
- Vision, mission and valuesWhere the organisation is going and why
- Priorities and pillarsNational or corporate themes, with weights
- Strategic objectivesCascaded to sectors, departments and teams
- KPIs and OKRsFormula, baseline, targets, thresholds, owner
- Initiatives and projectsMilestones, budgets and benefits
- Approved results and evidenceSubmitted, validated, approved, audited
- Risk and controls
- Quality and excellence
- Data governance
How performance is scored
Each result becomes an achievement percentage against target, respecting direction (higher or lower is better). Scores roll up by weight to objectives, pillars and the overall execution score.
Thresholds are set per KPI, with a separate critical level.
Use the method you already have
- Balanced scorecard
- OKRs
- KPIs
- Strategy maps
- Annual operating plans
- Project portfolios
- Key risk indicators
- Excellence models
- Customer experience
- Workforce indicators
- Service-level agreements
See the product
Real screens from Qstrata, shown with sample data. Pick a view.
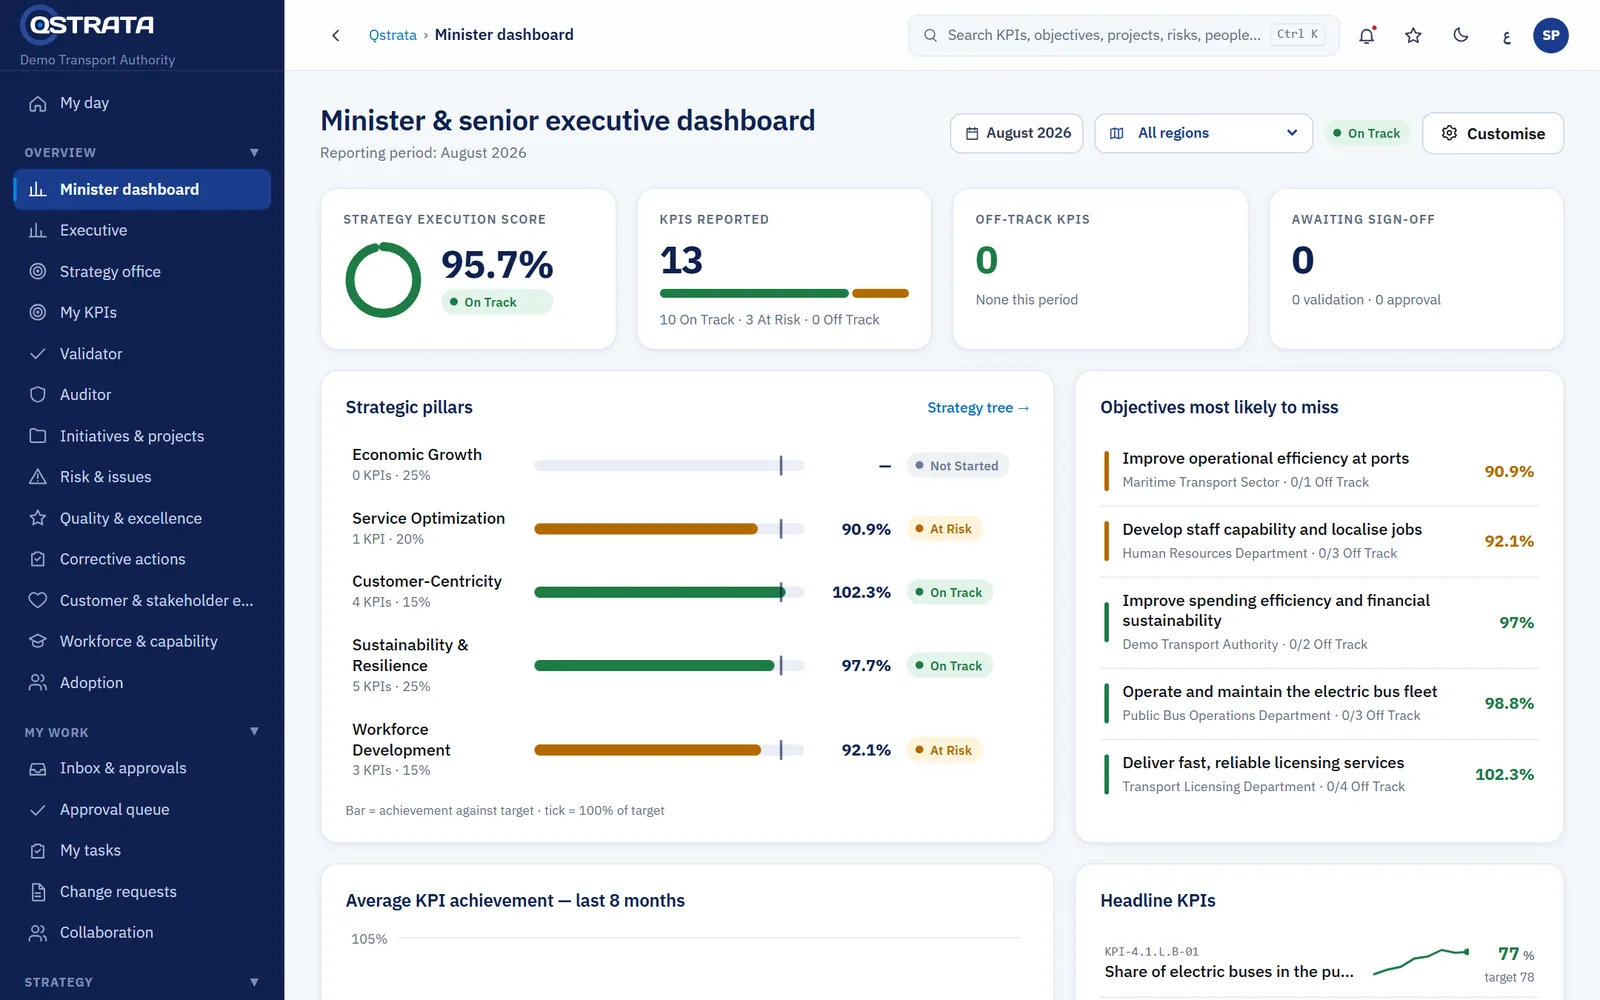
Executive dashboard. Execution score, pillar performance against target, the objectives most likely to miss, an eight-month trend with projection and headline KPIs. Filter by period and region.
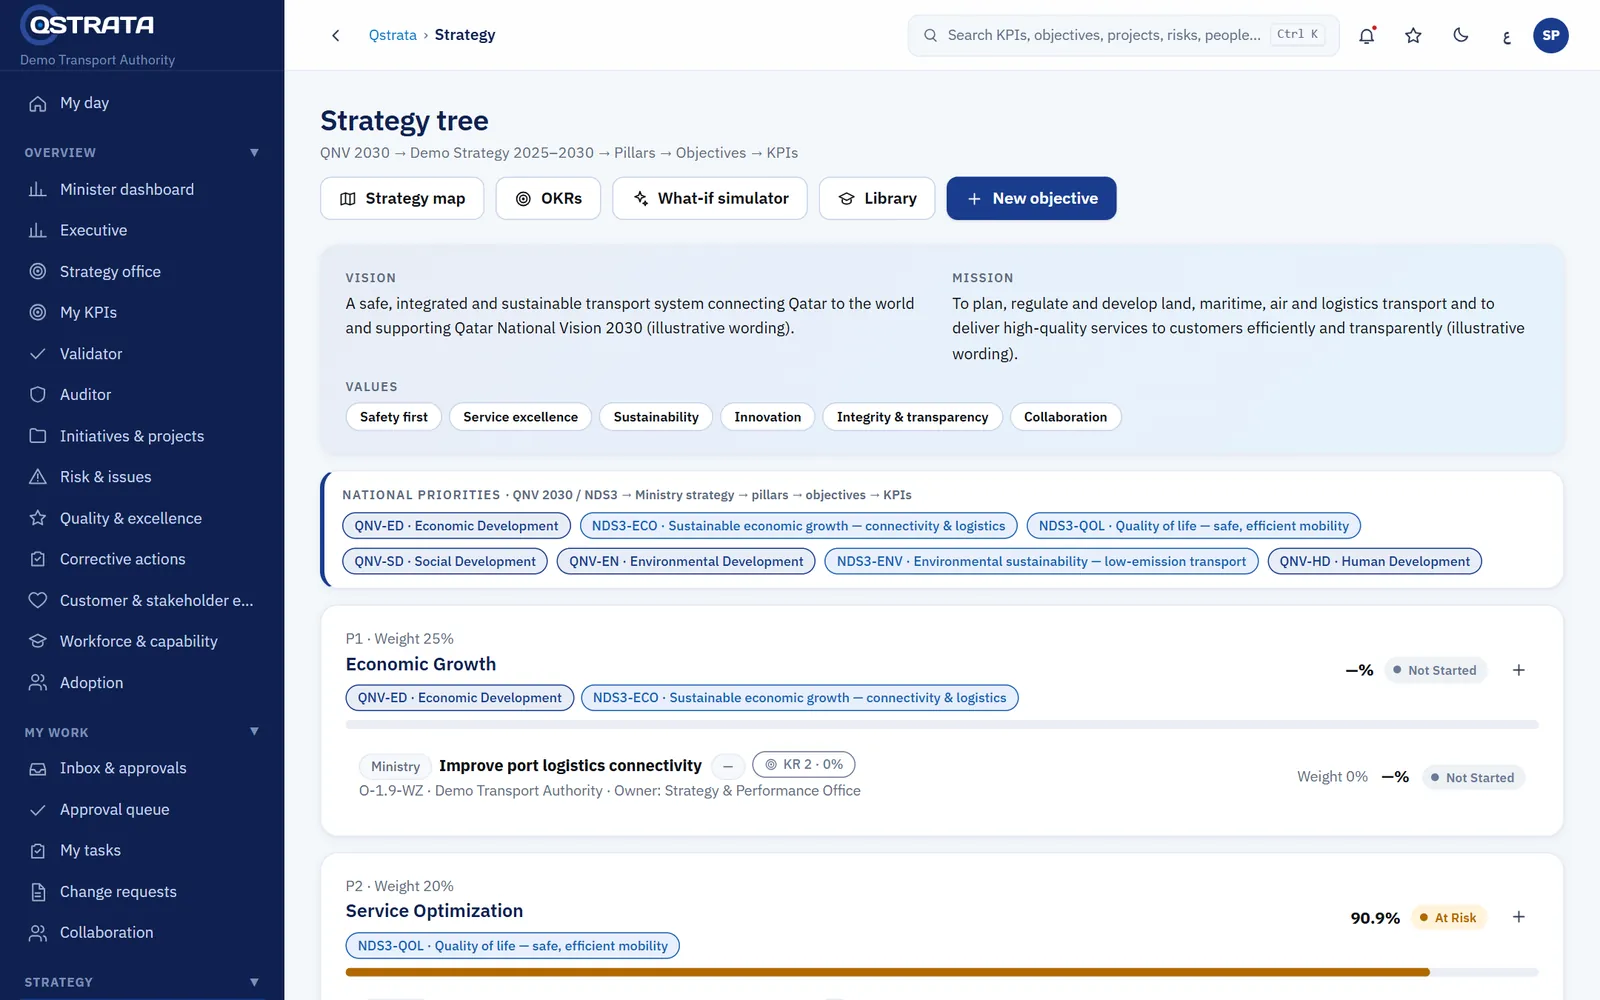
Strategy tree. Vision, priorities, pillars and cascaded objectives, with weights and scores rolling up.
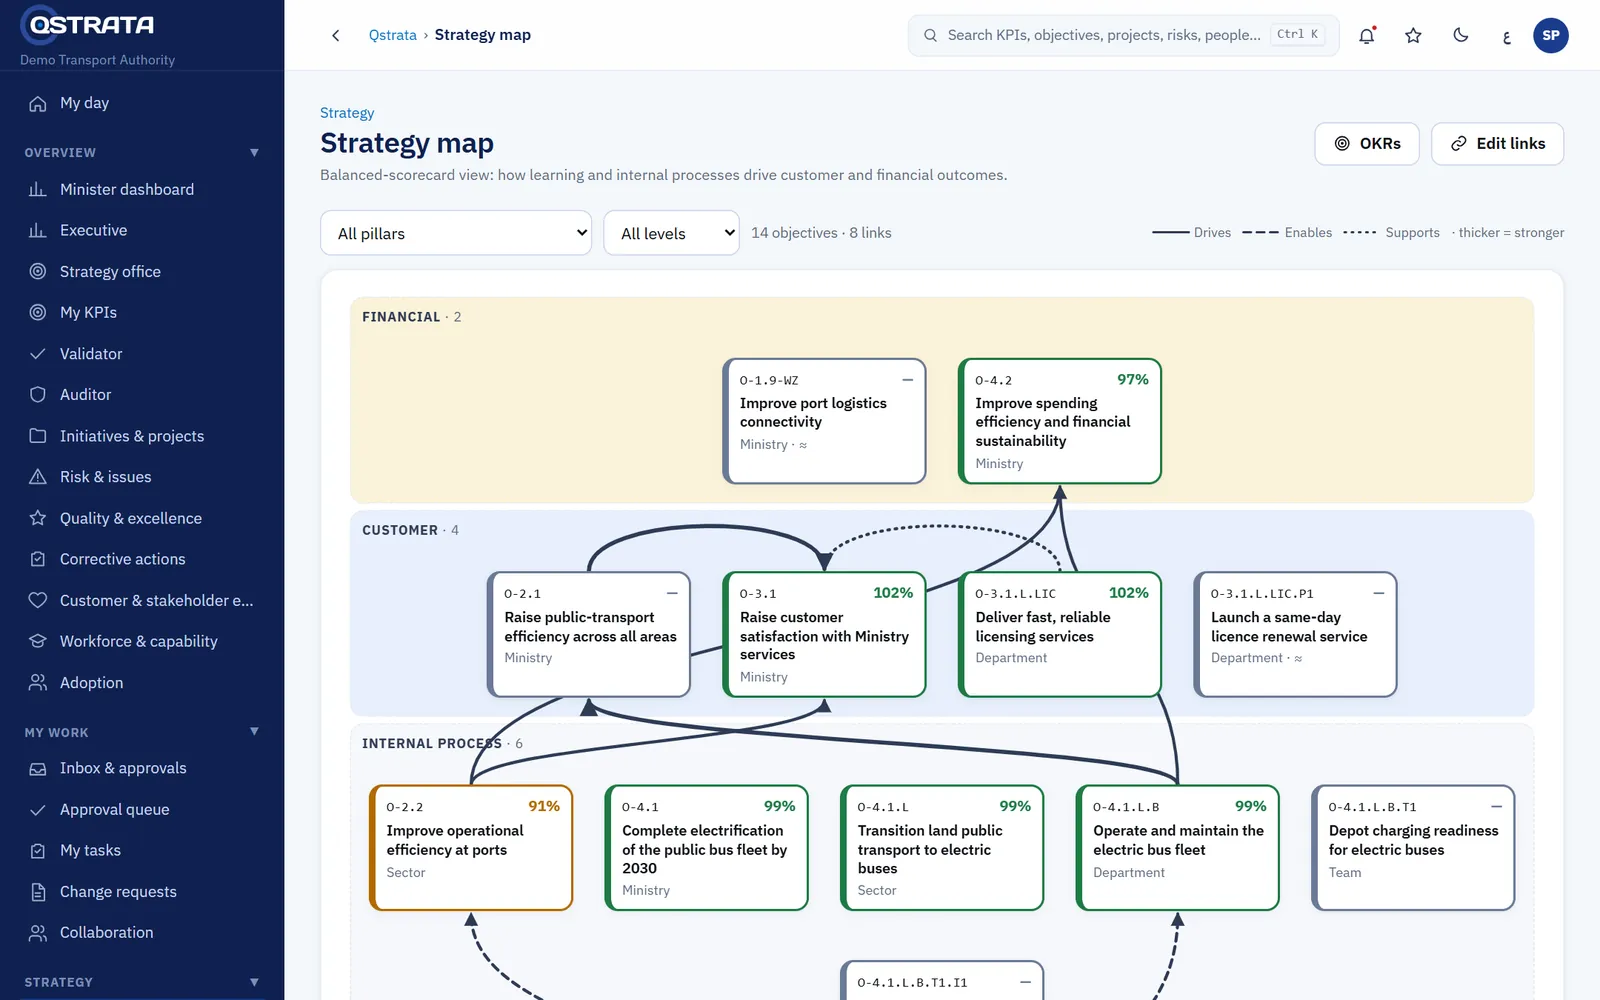
Strategy map. Balanced-scorecard perspectives with cause-and-effect links, coloured by live status.
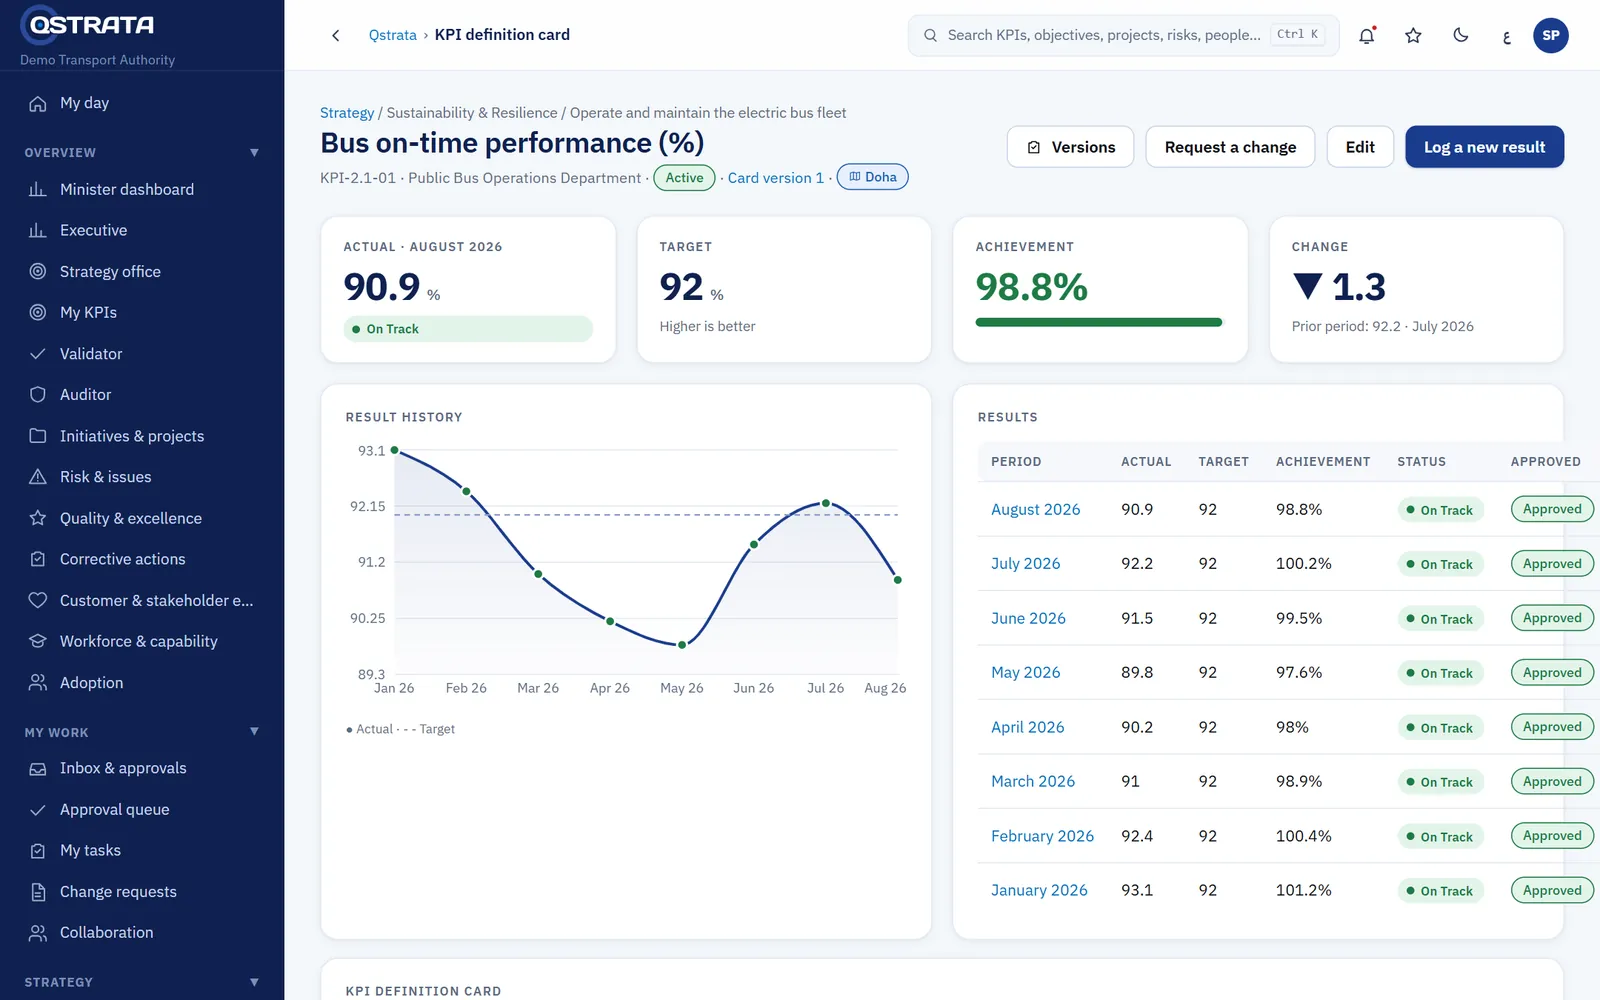
KPI card. Actual against target over time, achievement, owner and RACI, thresholds, evidence and every submission in one place.
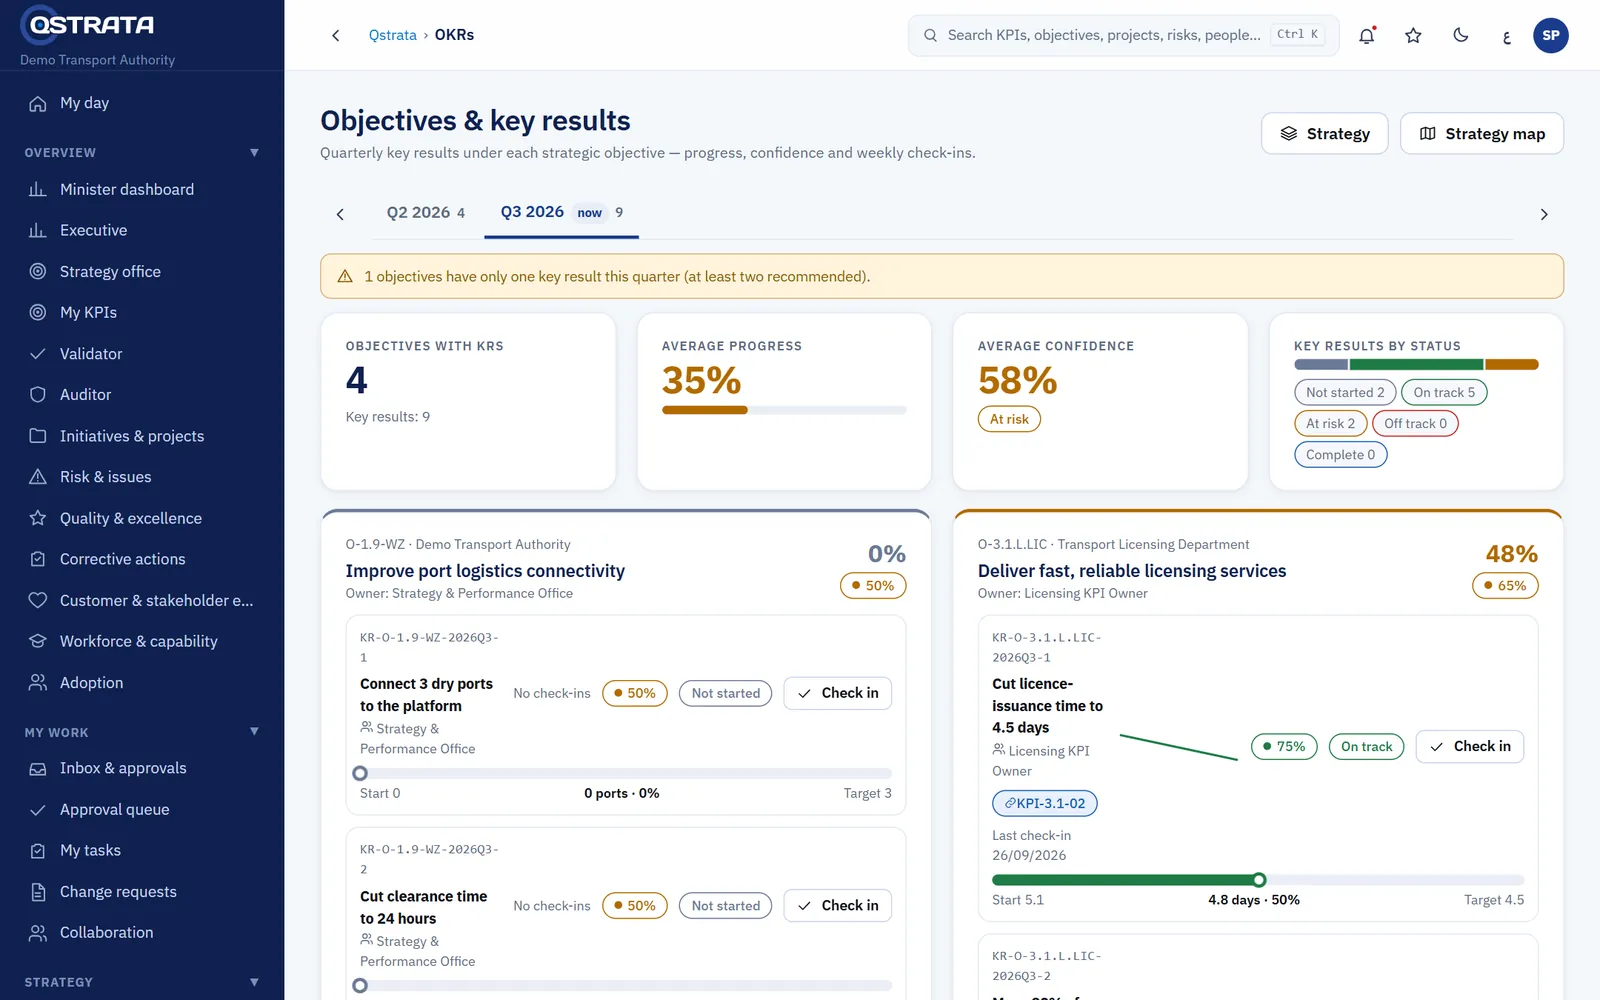
OKRs. Quarterly objectives and key results with progress, confidence and weekly check-ins, next to your KPIs.
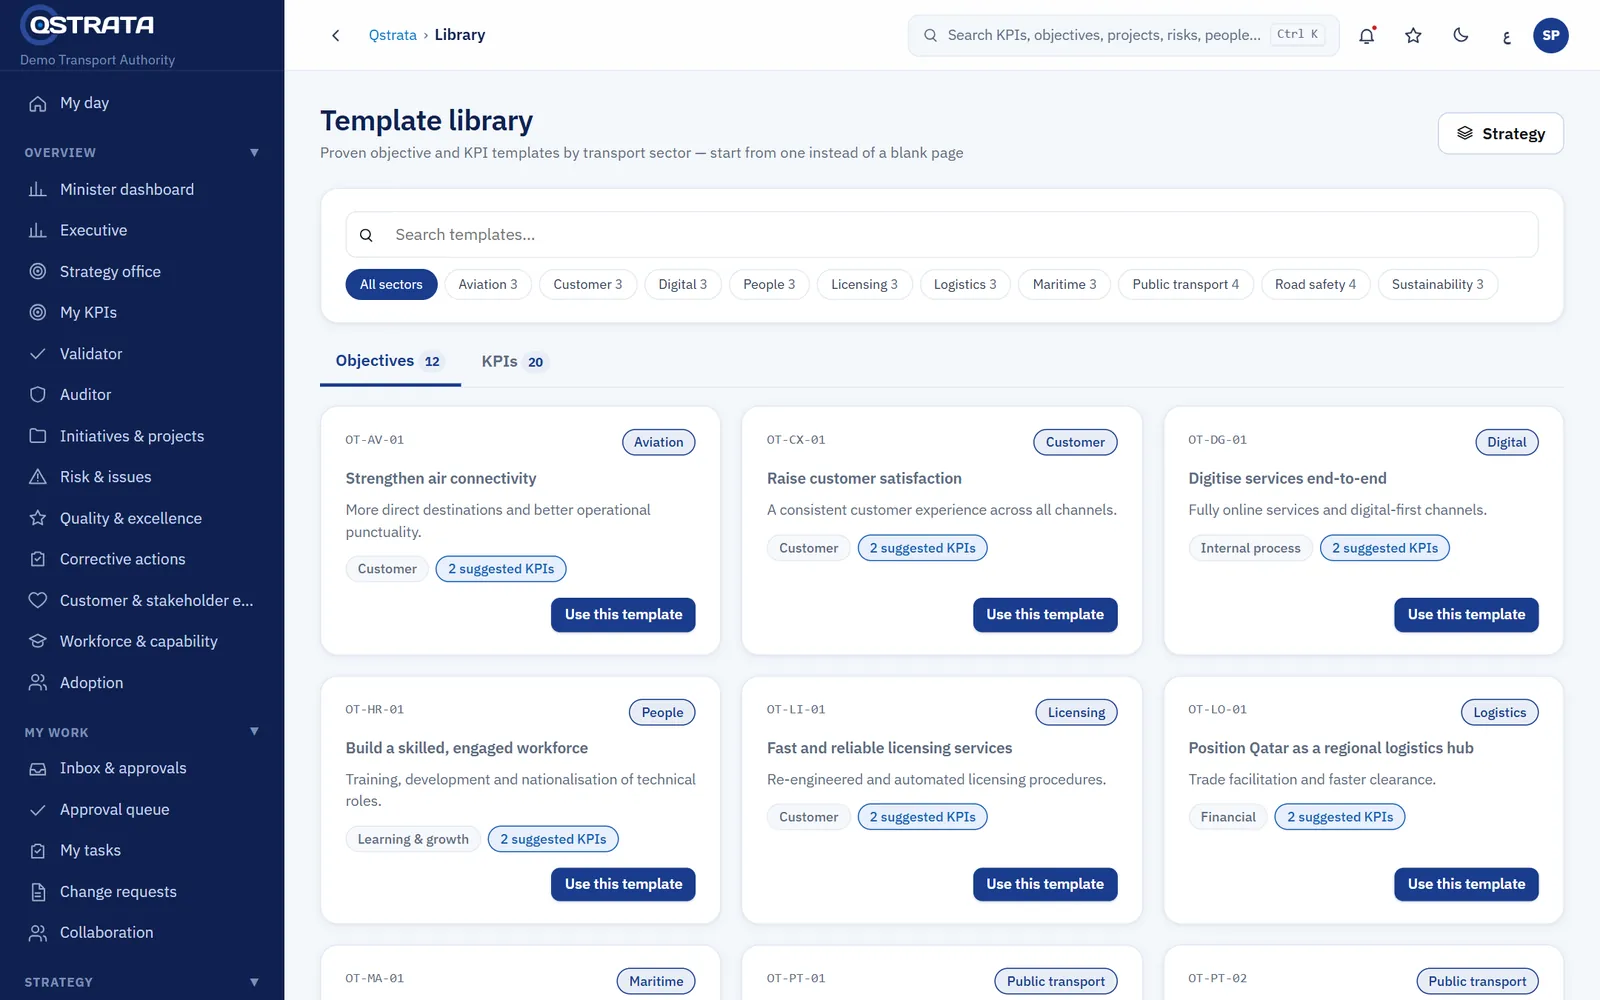
Template library. Ready-made objectives, KPIs and key results by sector and theme, to adopt and adapt instead of starting from a blank page.
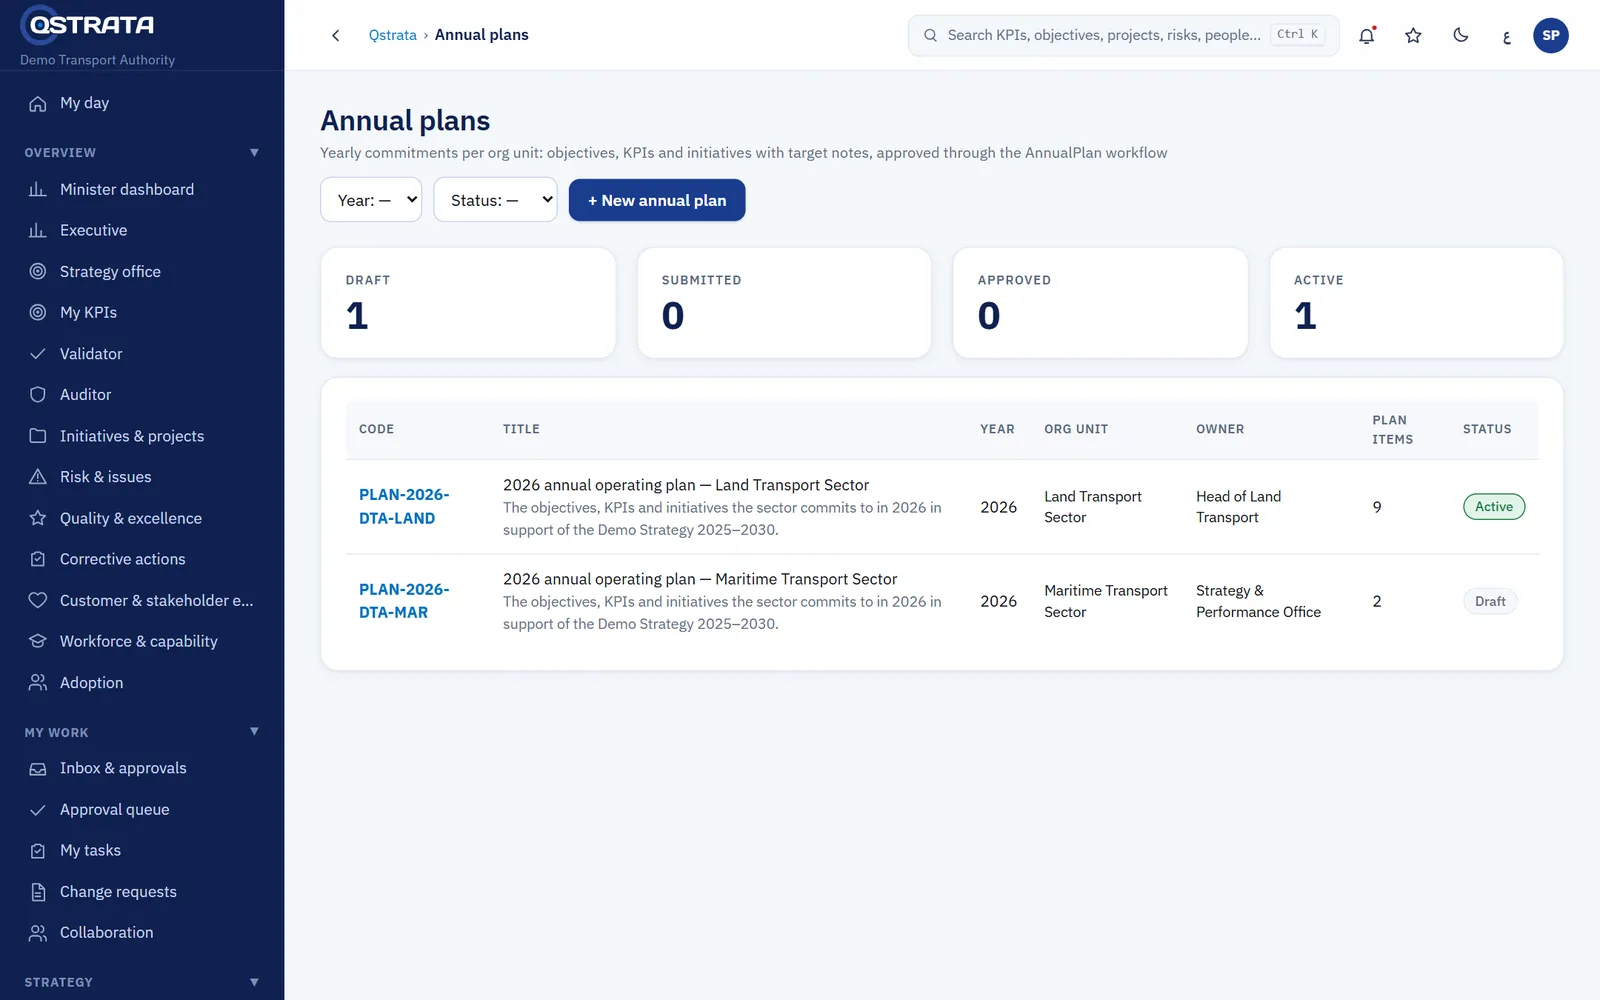
Operating plans. Annual operating plans by unit, with activities, budgets and the objectives they deliver.
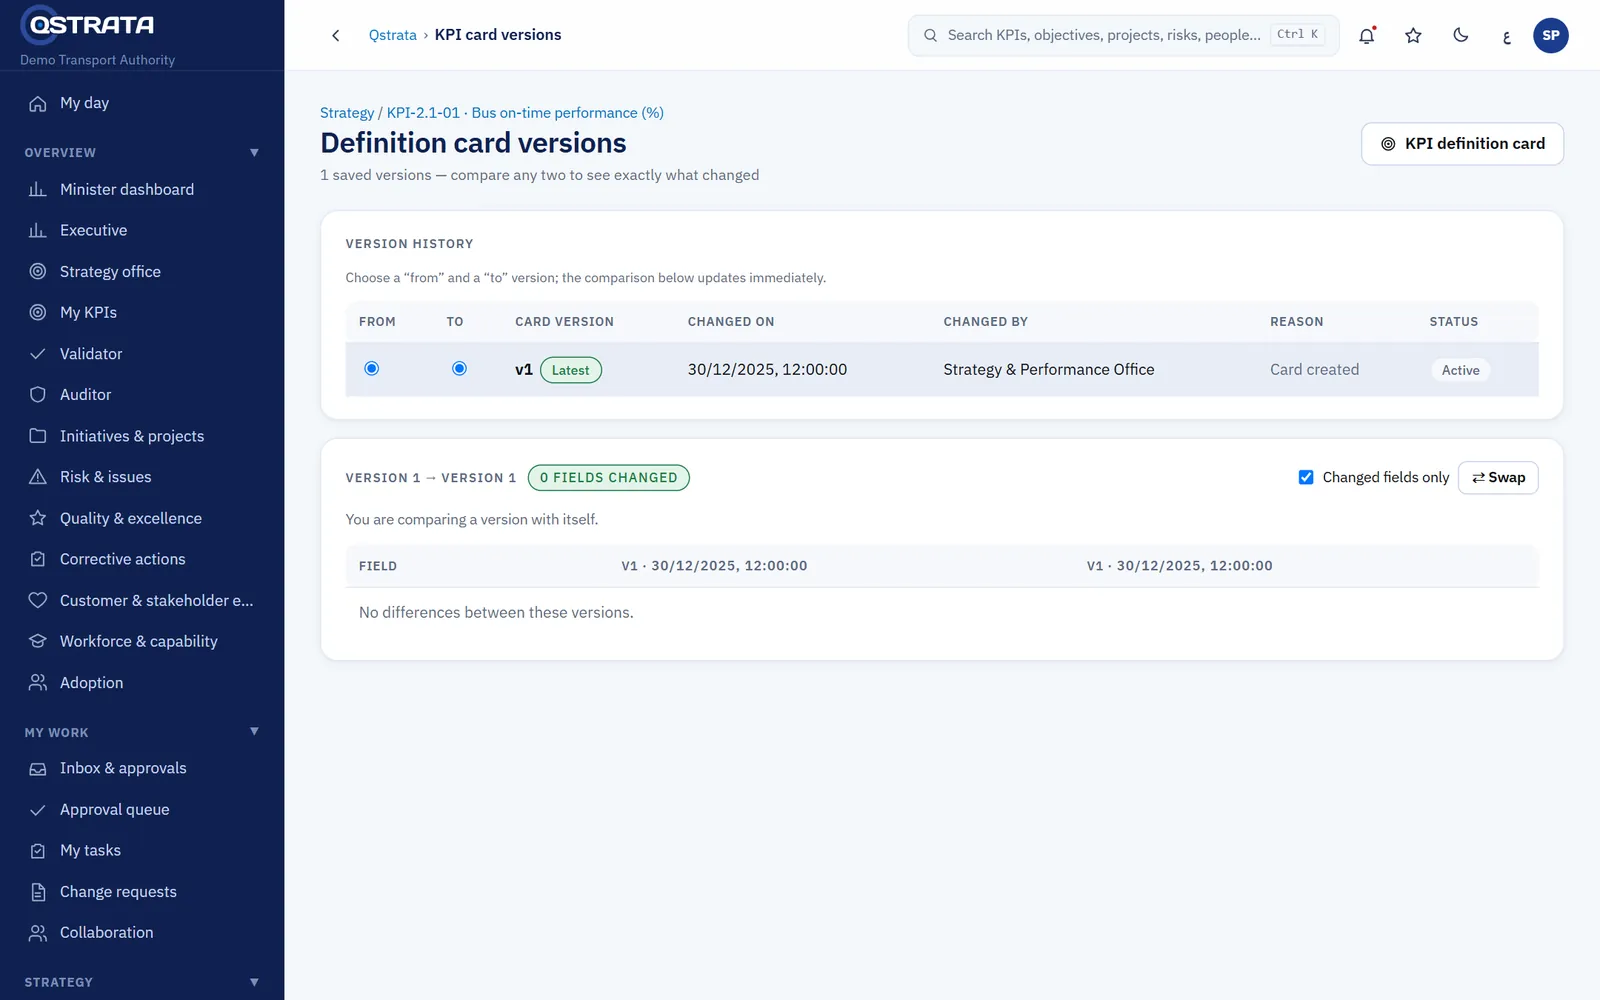
KPI history. Every change to a KPI definition is versioned, with a field-by-field comparison and the reason for the change.
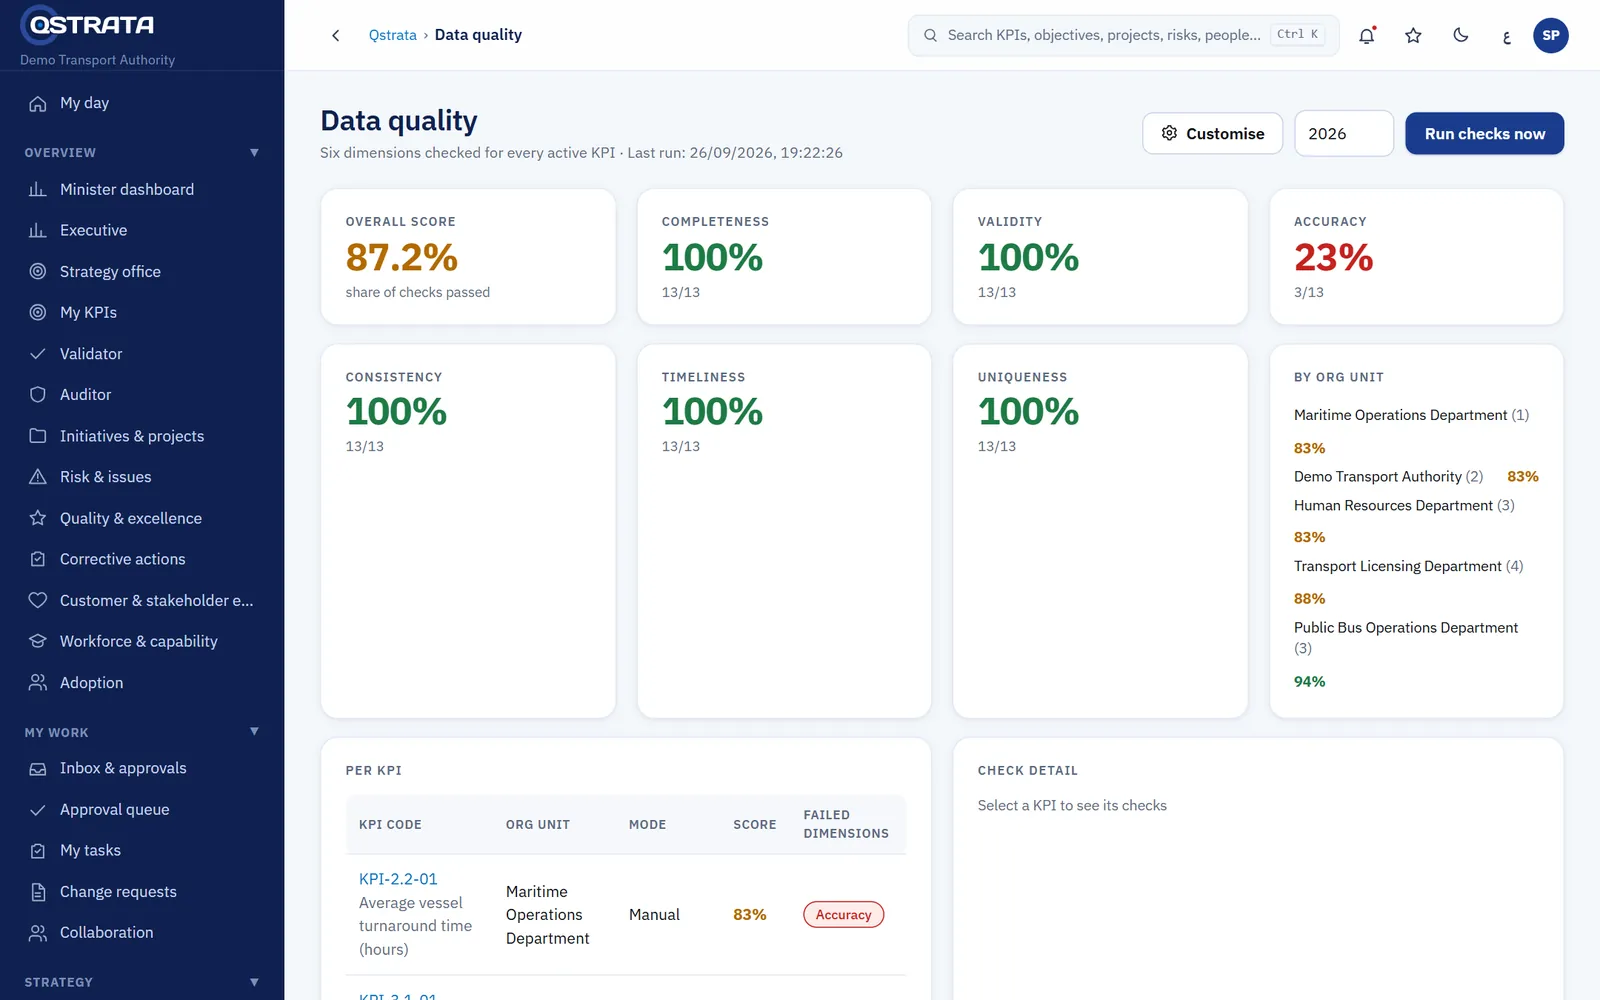
Data quality. Completeness, validity, timeliness, consistency, uniqueness and accuracy scored for every KPI and unit.
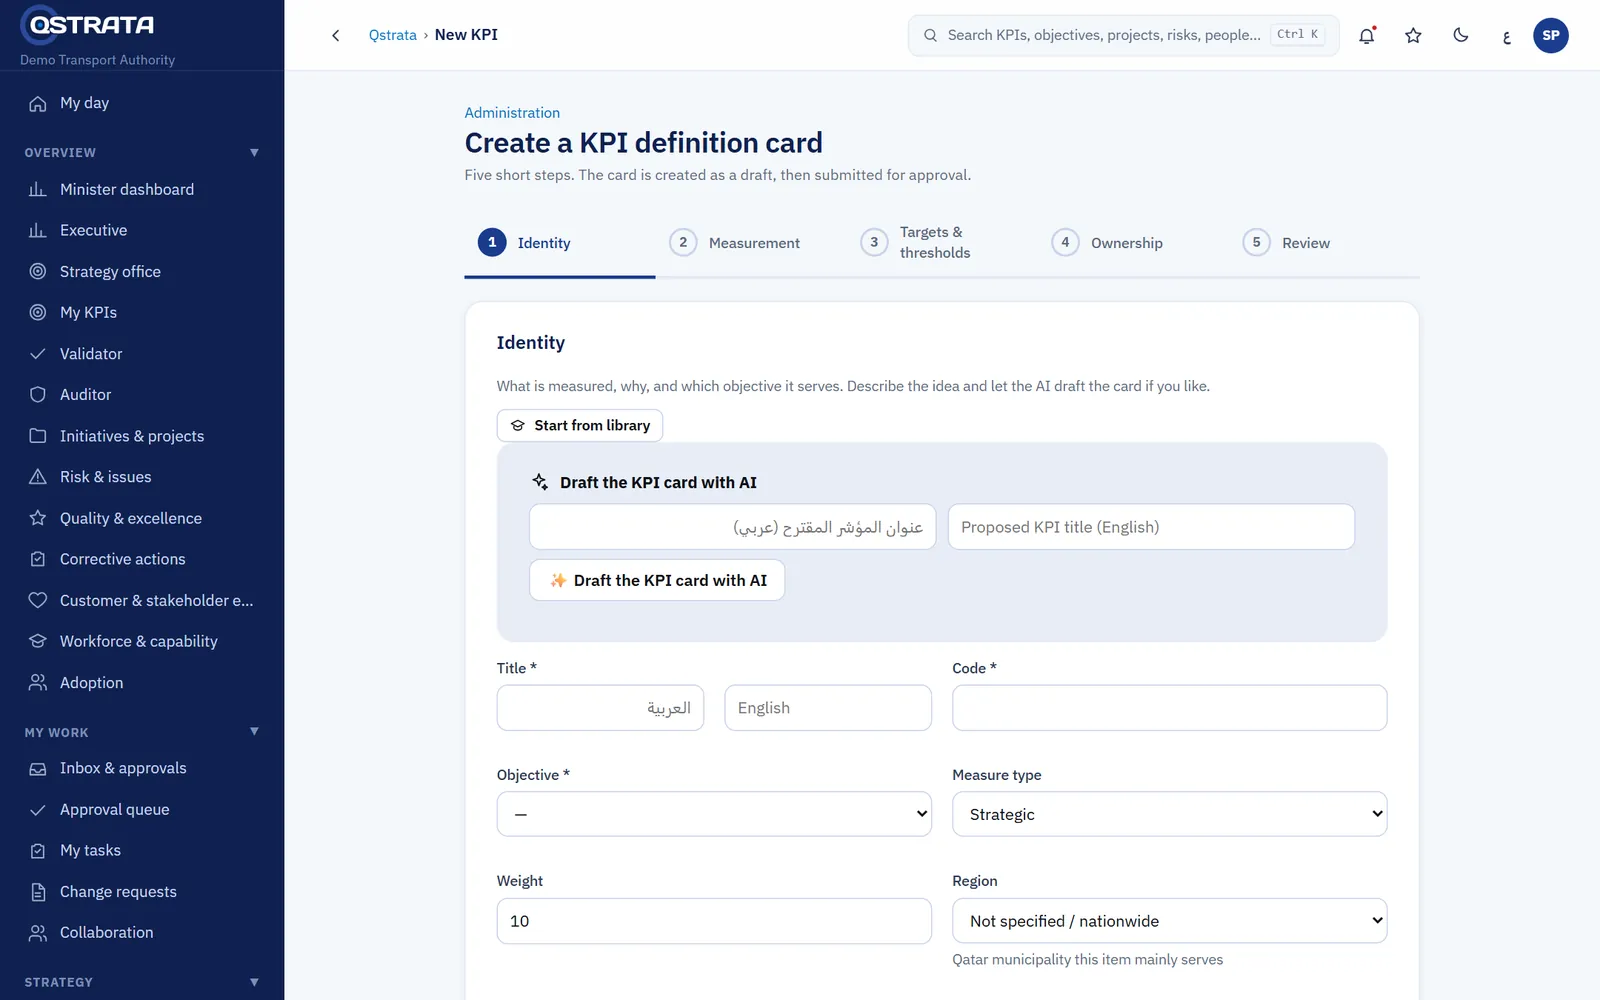
Objective wizard. Create an objective in guided steps from a template library, with AI-drafted key results.
Everything the performance cycle needs
Twelve modules that work as one system, configured to your structure, your terms and your approval routes.
Strategy
Strategy and cascade
Vision, mission, values, priorities, pillars and objectives cascaded to sectors, departments, teams and individuals. Bottom-up proposals and orphan checks.
OKRs
Two to five key results per objective, confidence scores, weekly check-ins and a quarterly review pack.
KPI management
Complete definition cards: formula, baseline, targets by period, weights, thresholds with a critical level, data source, owner and RACI. Full version history.
Performance
Results and evidence
Submit, validate and approve with segregation of duties. Evidence is encrypted at rest and every value keeps its source and history.
Portfolio
Programmes, initiatives, projects, milestones, tasks, budgets, benefits and dependencies, linked to the objectives they serve.
Risk and controls
Inherent and residual risk, a configurable matrix, appetite limits, key risk indicators, treatments and a controls register.
Quality and excellence
Assessments, maturity scoring, findings and corrective actions, with benchmarks and follow-up.
Insight
Reports
Scheduled and on-demand packs with charts, heat maps and strategy maps, AI narrative under review, secure share links.
Data and governance
Data governance
Lineage, glossary, data stewards, six quality dimensions, reconciliation and controlled restatement.
Workflows and forms
A no-code designer for approval routes, forms, custom fields, roles, reminders and escalations.
Collaboration
Comments and mentions, recognition, one-to-one agendas with calendar invites, and a town-hall display mode.
Integrations
REST, HR, ERP and CRM connectors, SQL databases, SFTP, project tools, Microsoft Teams and Slack, a BI data feed and webhooks.
Dashboards
A dashboard for every role, live the moment a result is approved
Leaders see the whole picture. Owners see what needs doing today. Every dashboard can be filtered by period and region, rearranged, and drilled to the evidence behind a figure.
Chief executive or minister. Execution score, pillar performance, a trend with projection and the objectives most likely to miss.
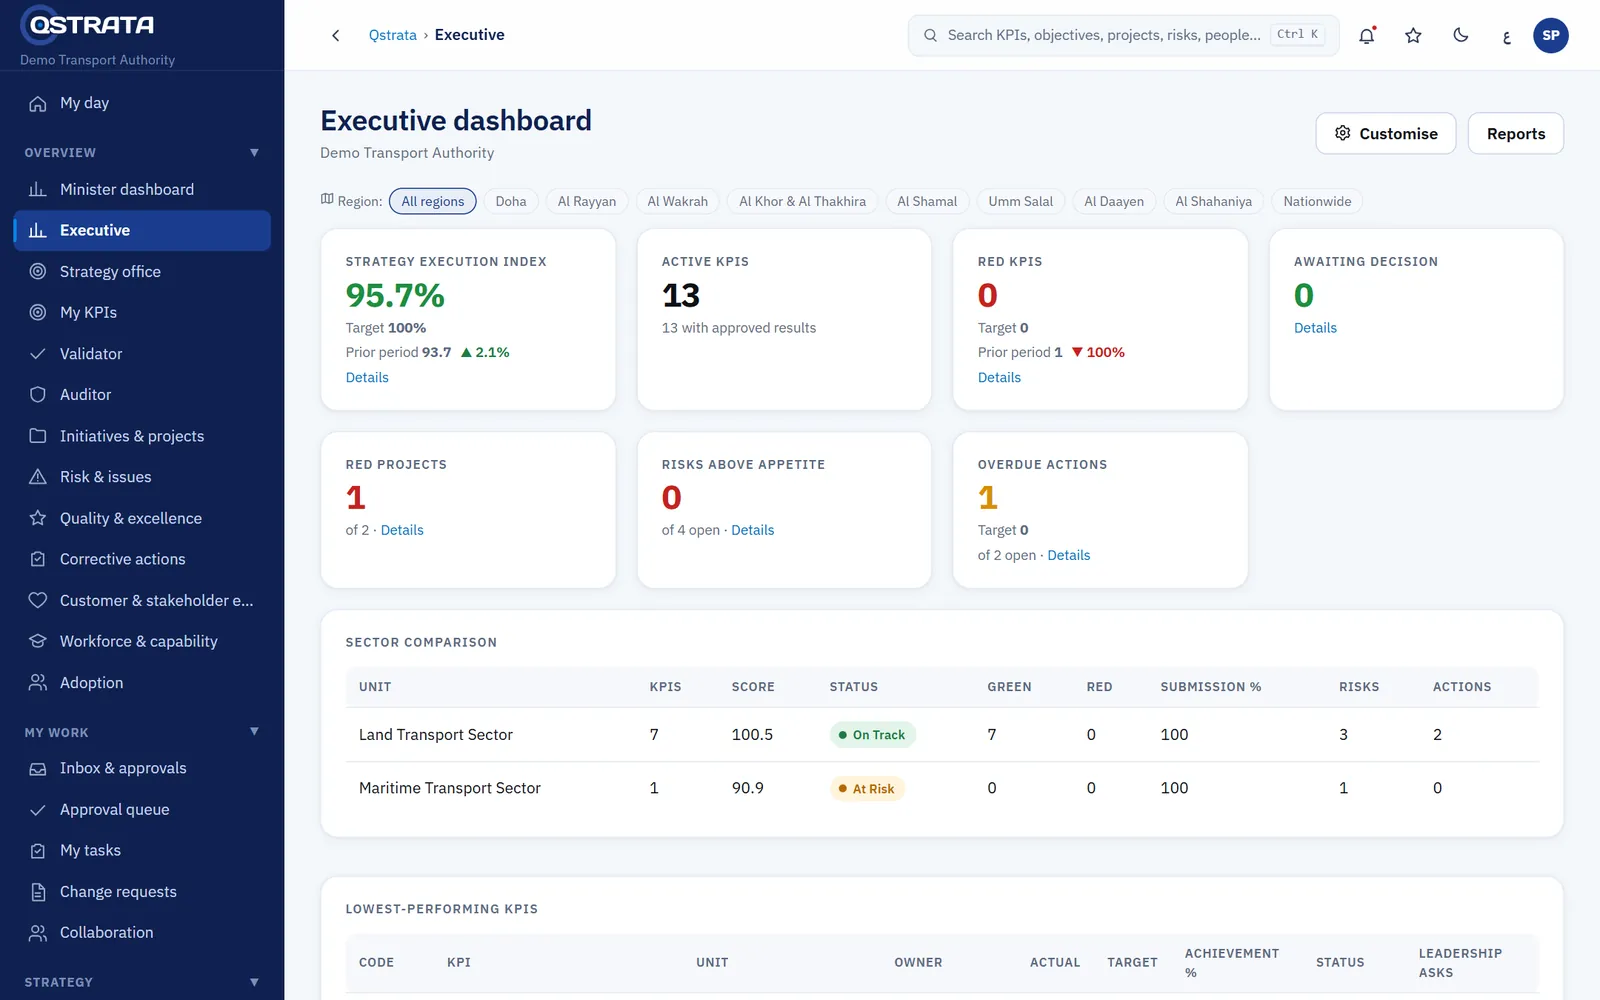
Executive team. Sector comparison, off-track KPIs and items waiting for decision.
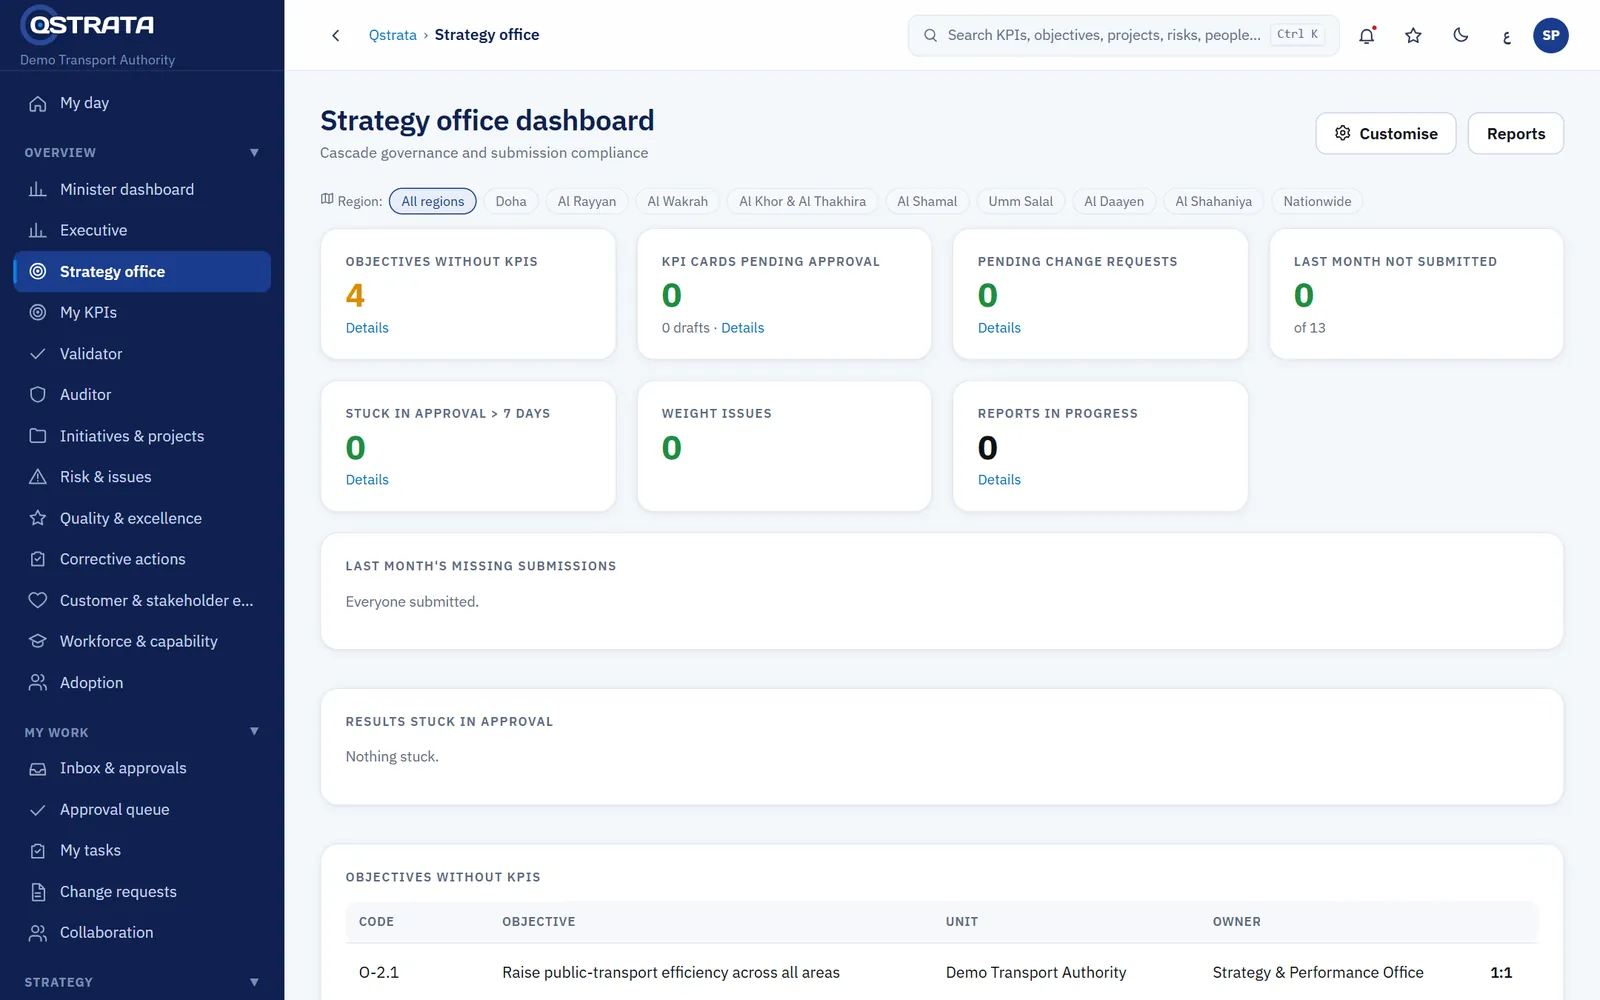
Strategy office. Coverage, submission status by unit, validation backlog and cascade health.
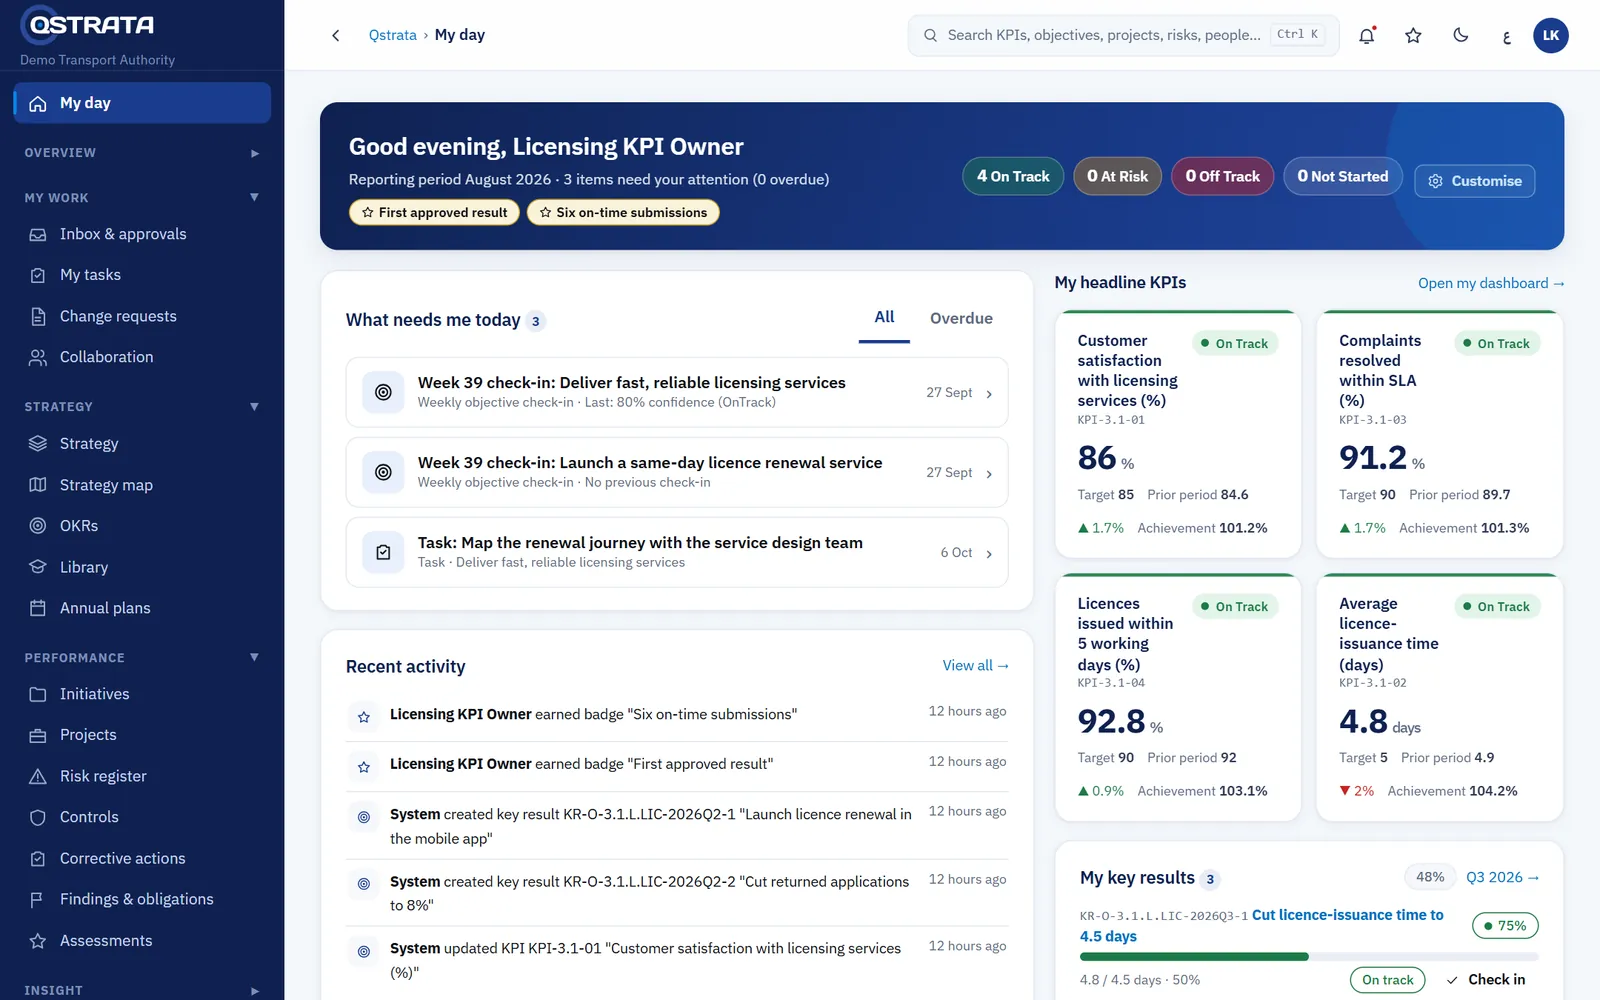
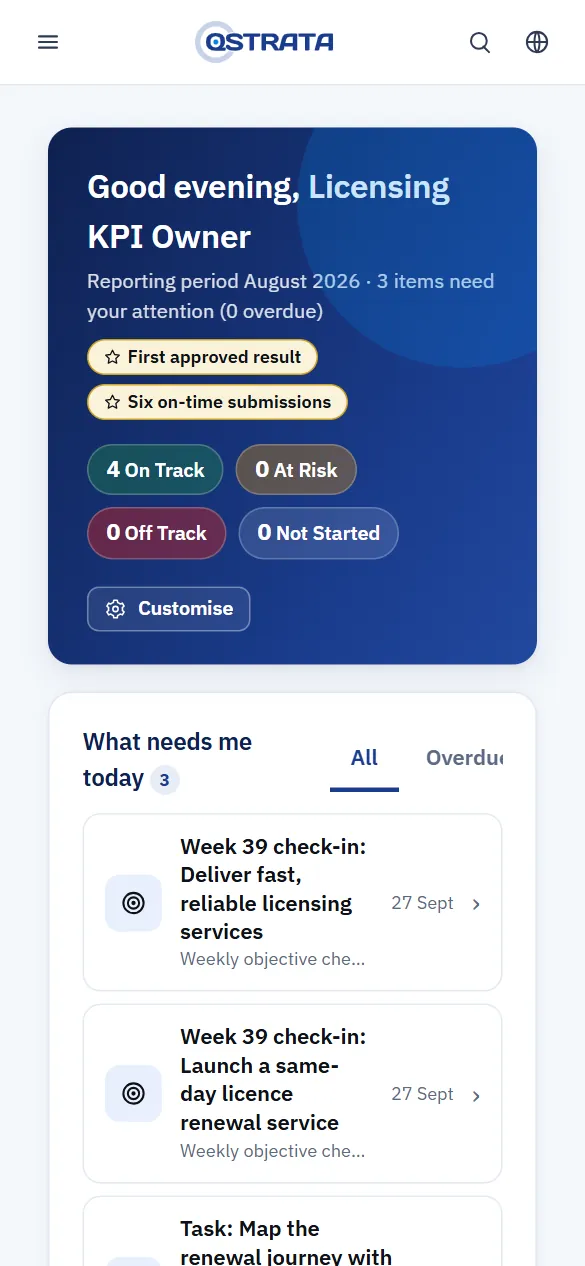
KPI owner · My Day. Results due, returned submissions, tasks and check-ins in one list.
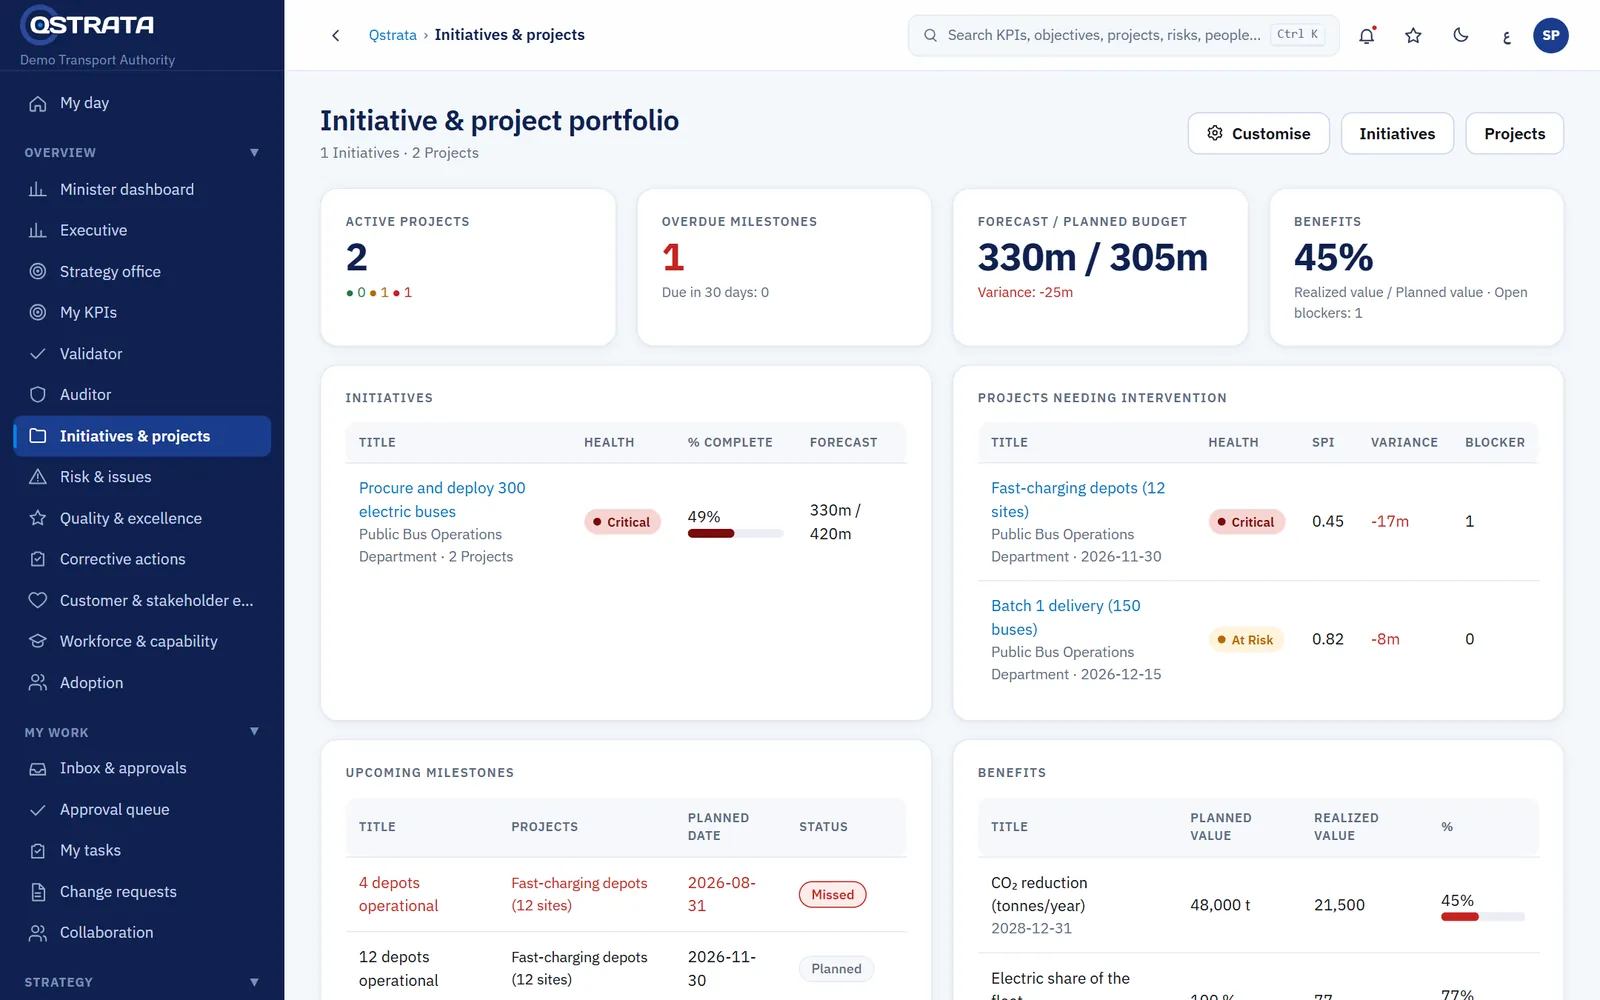
Portfolio office. Initiative and project health, budget against actual and overdue milestones.
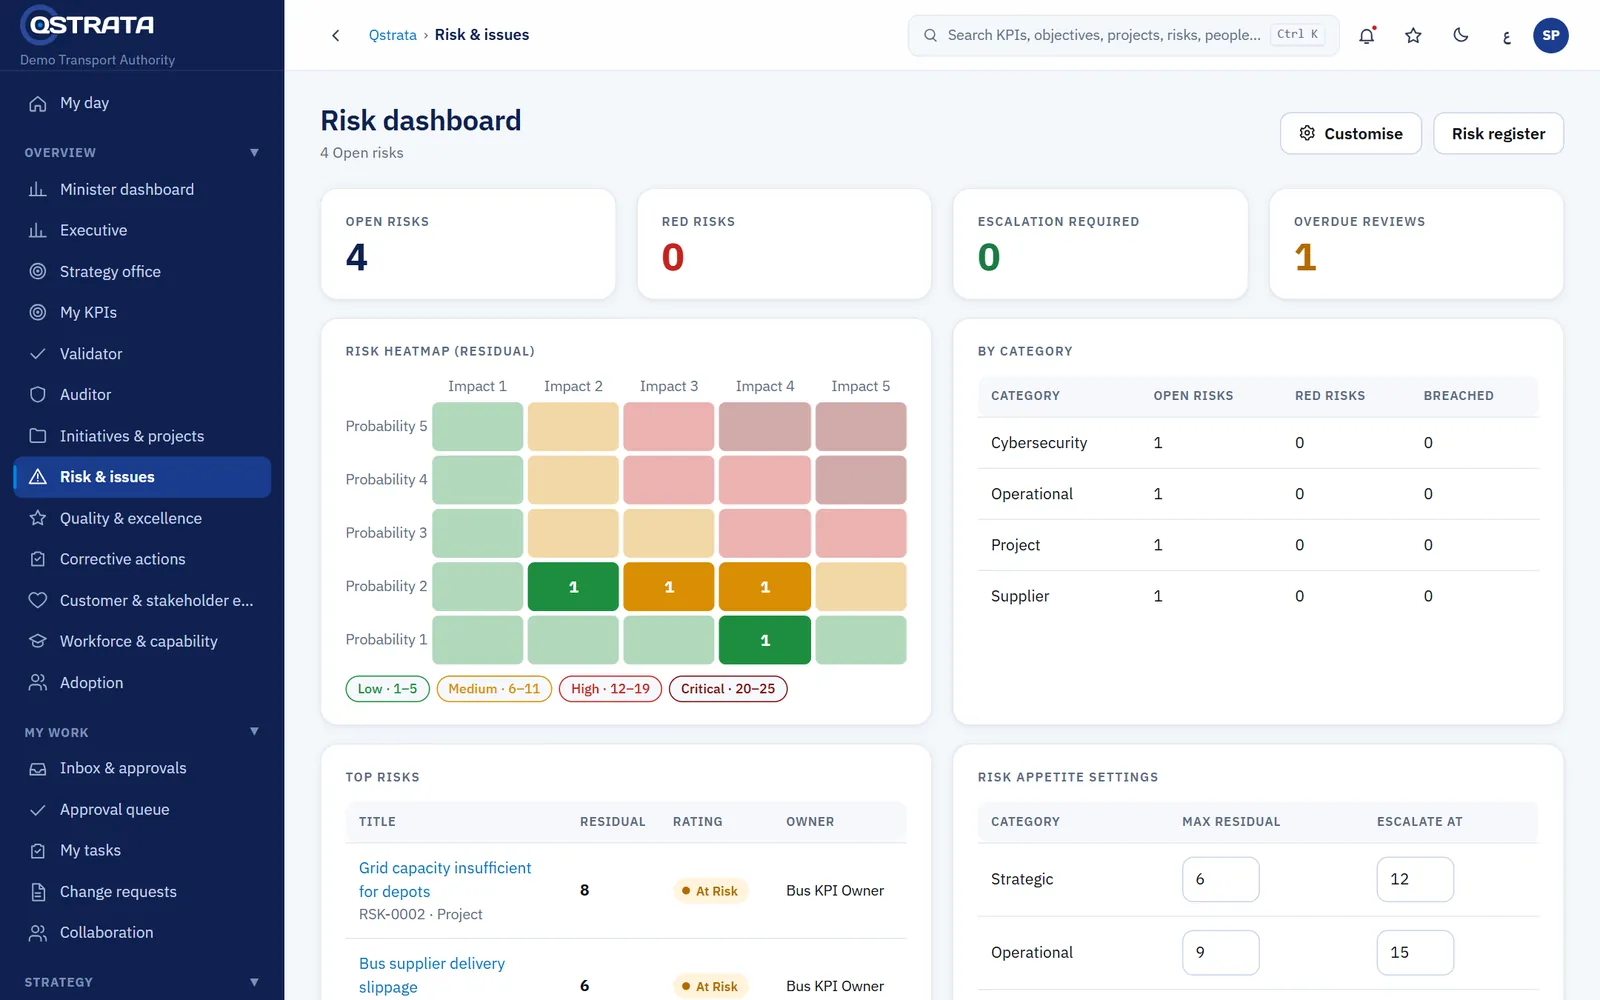
Risk office. Residual heat map, appetite limits, top risks and key risk indicators.
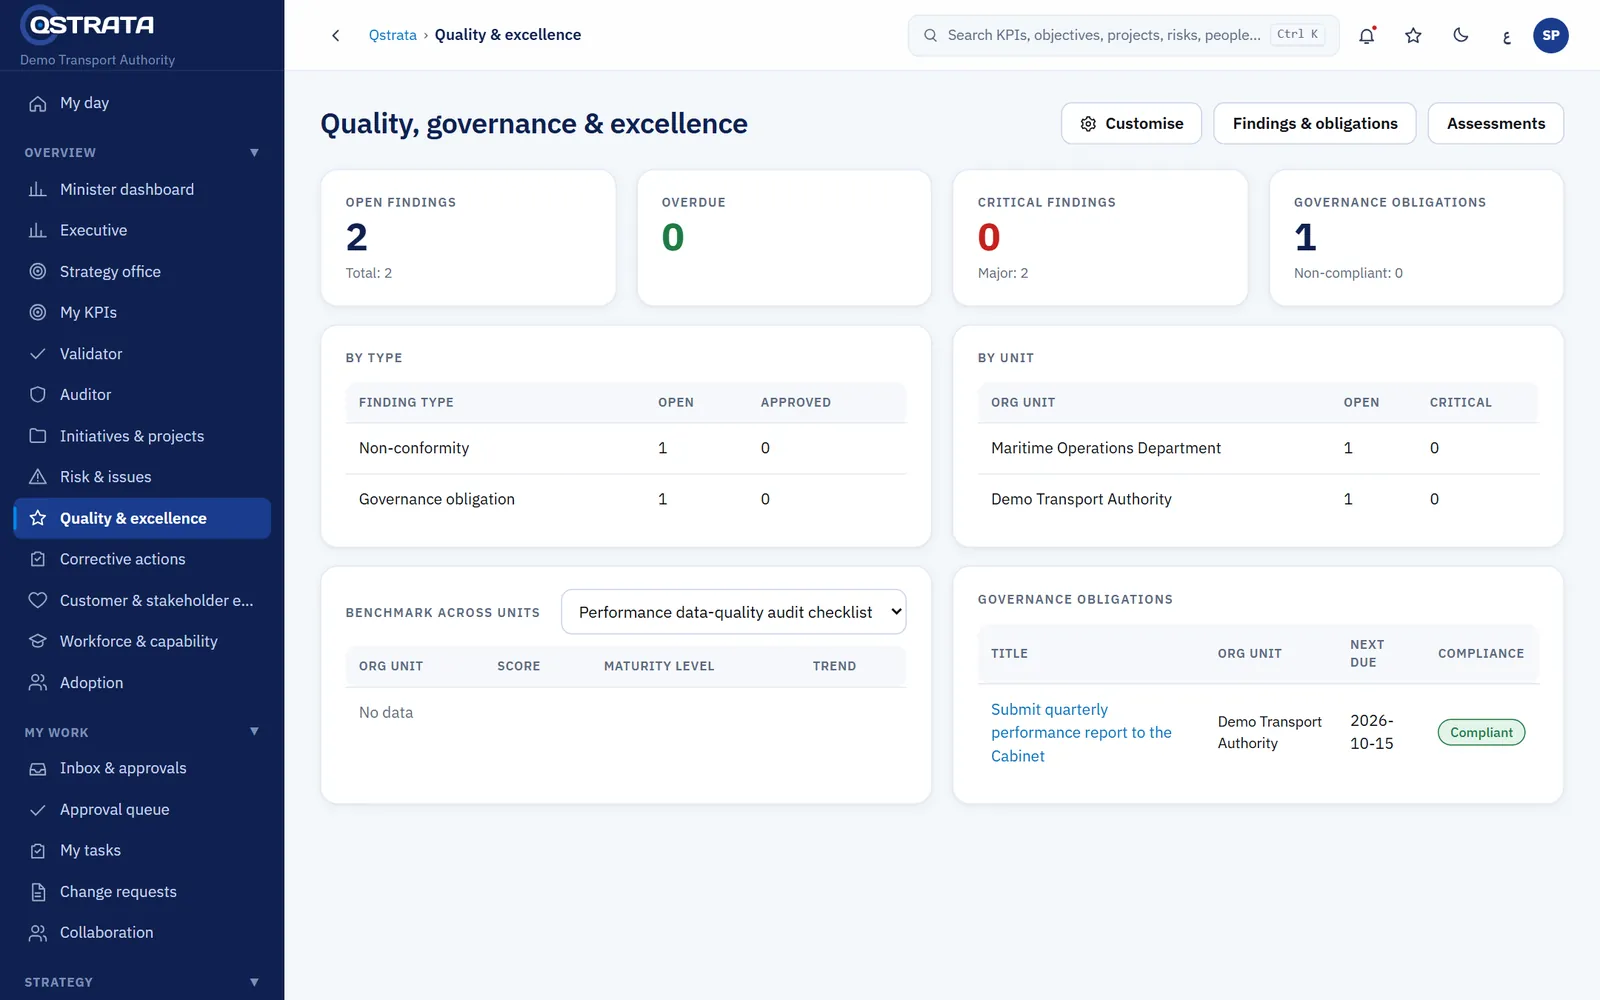
Quality and excellence. Assessment scores, maturity levels and open findings.
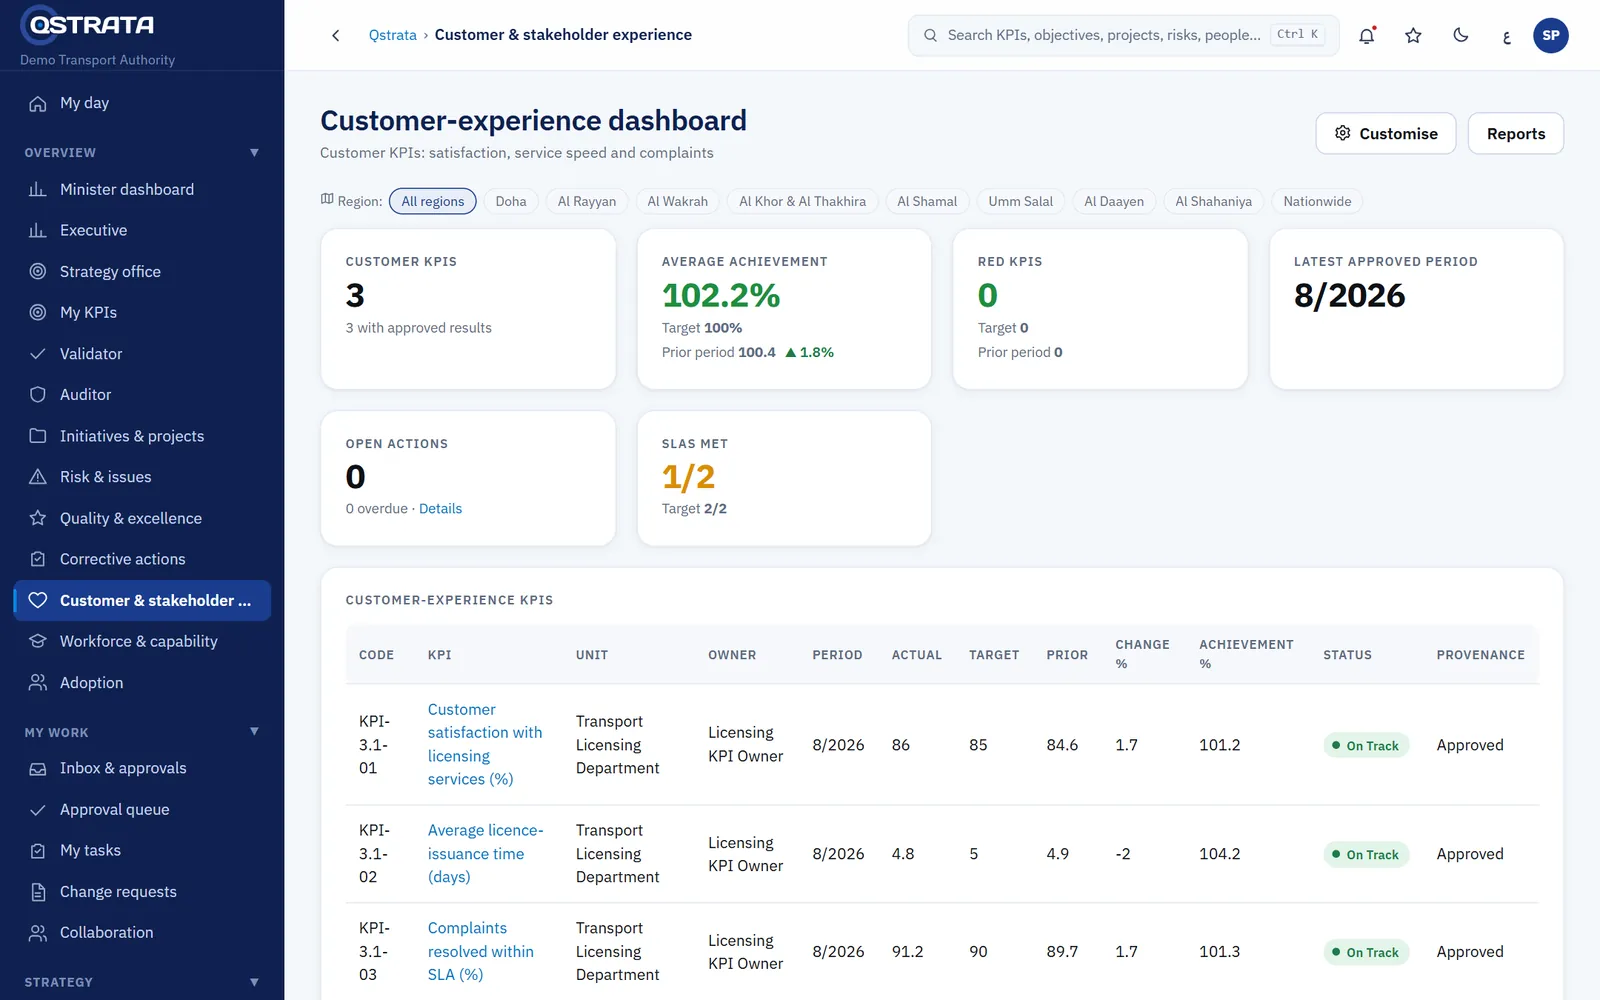
Customer experience. Service levels met or missed, month by month.
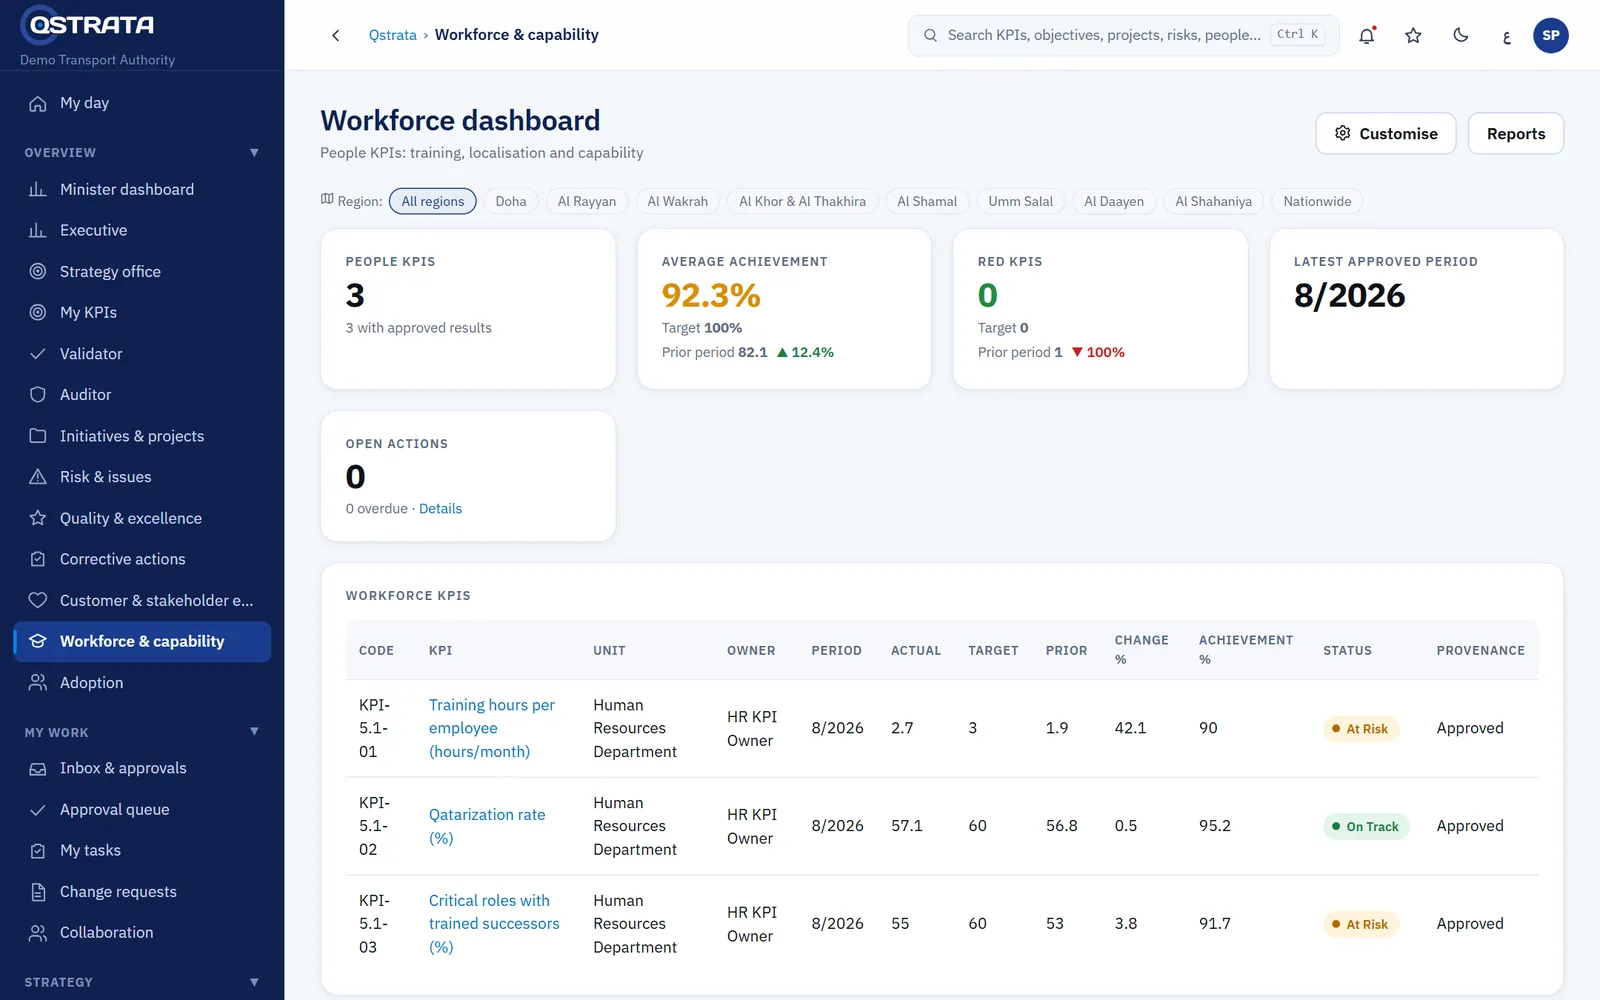
Workforce and capability. People indicators, training and capability gaps.
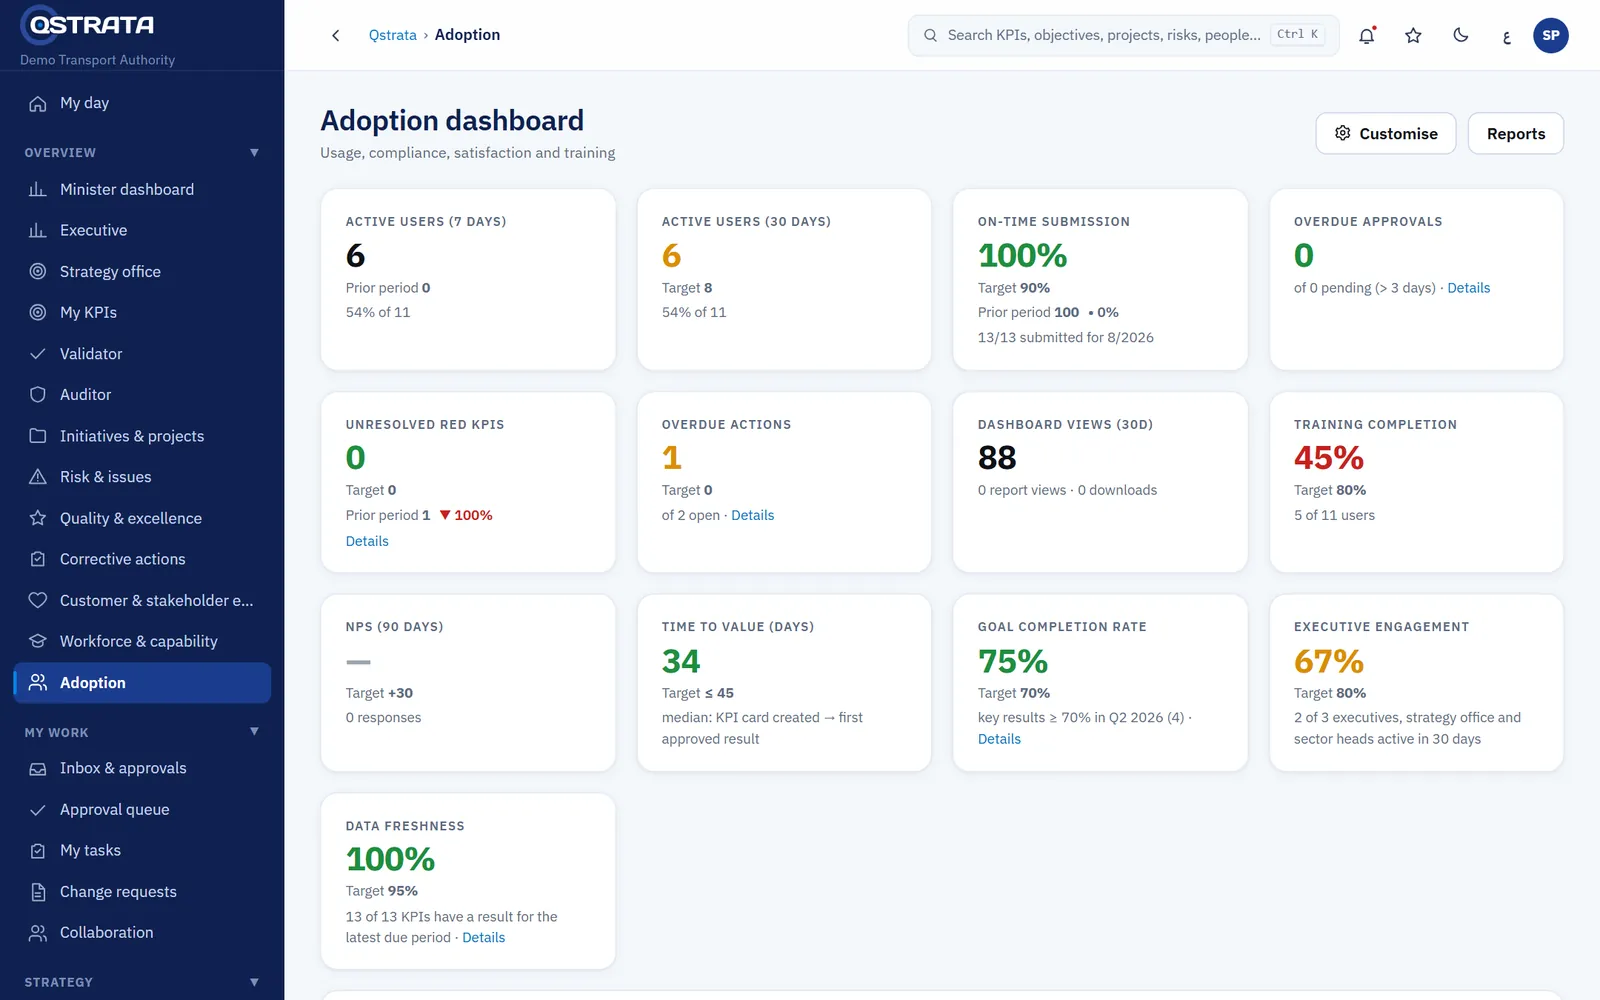
Adoption. Active users, on-time submissions and data freshness.
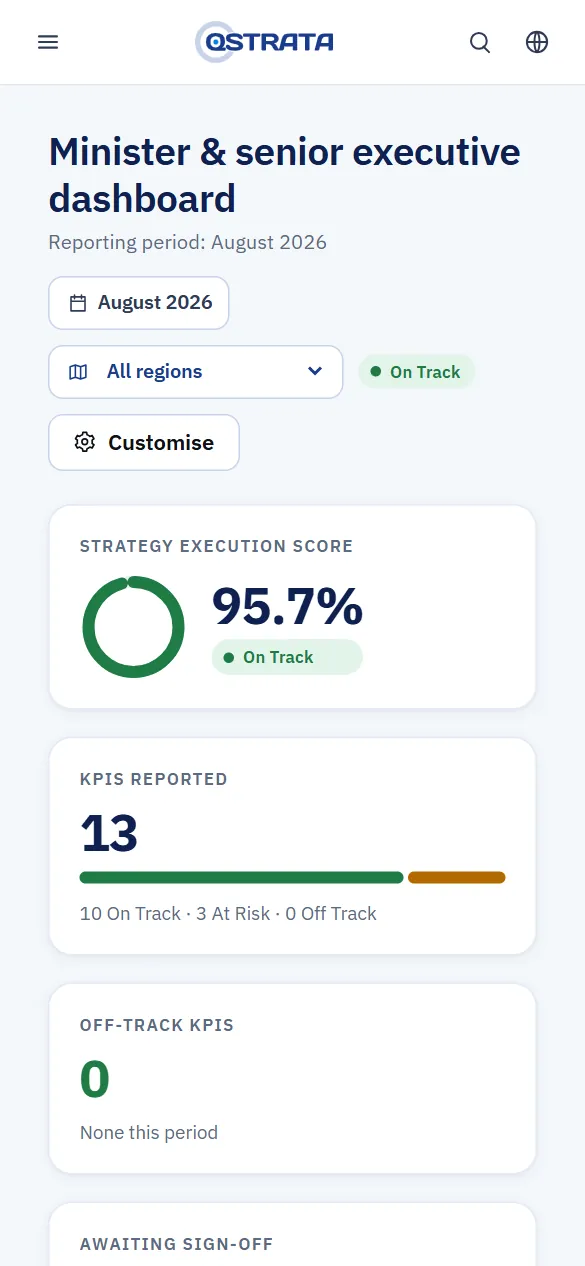
On the phone, too
Owners submit results and leaders check the score from any device, in English or Arabic.
Reporting
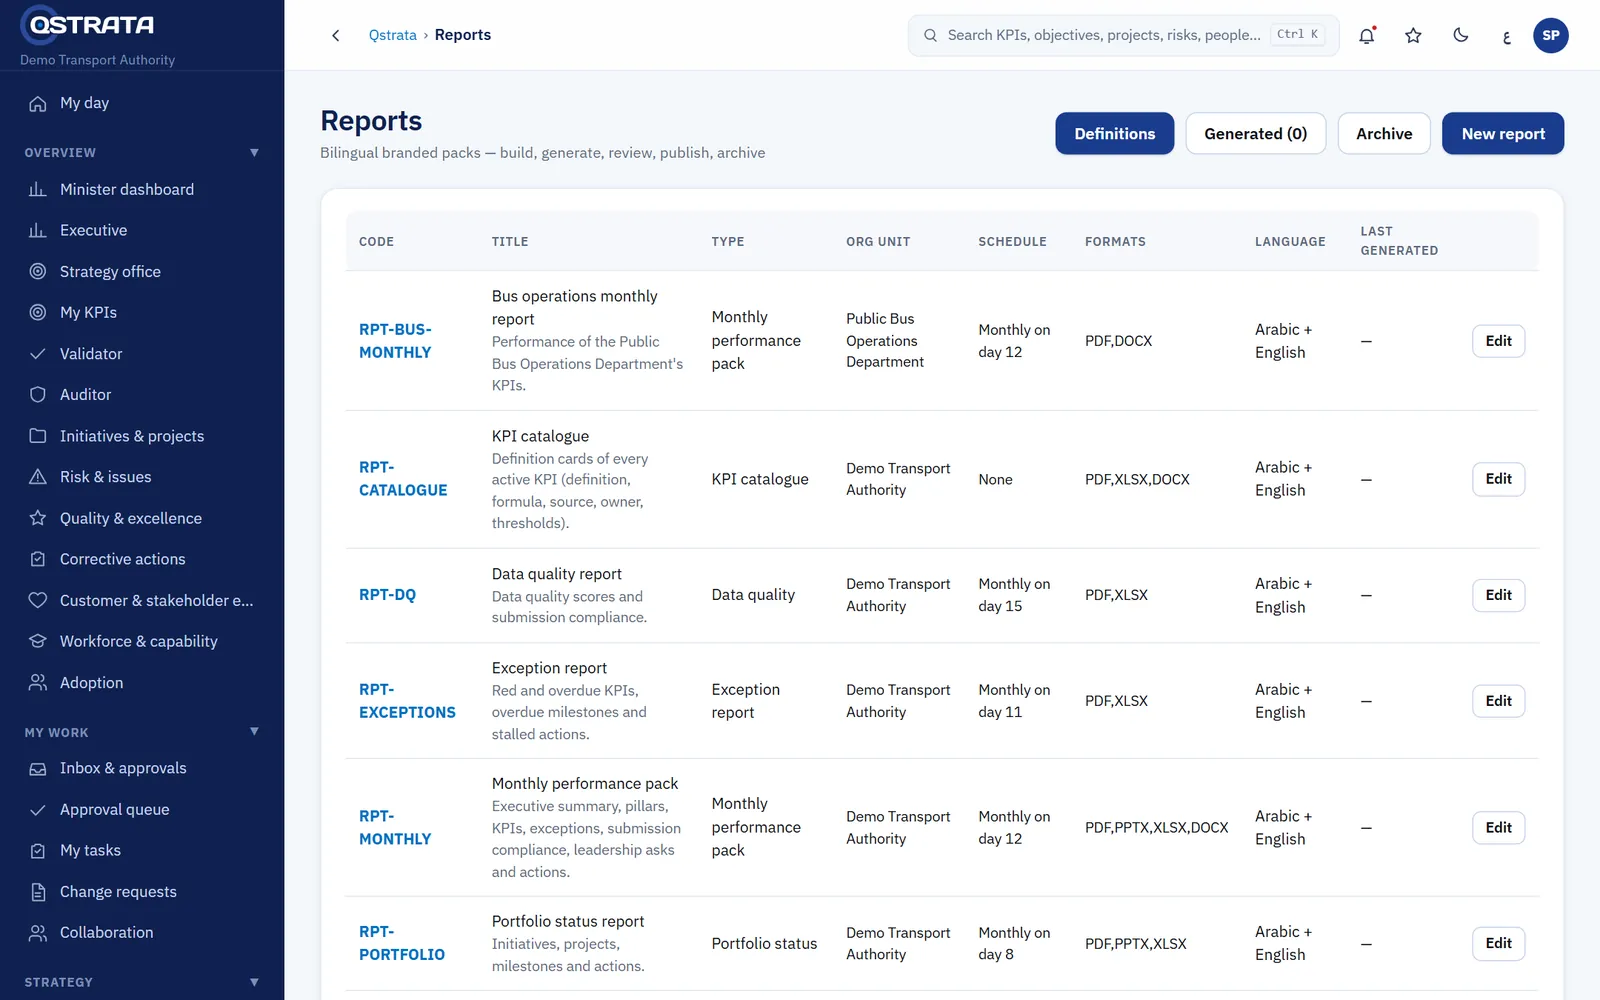
Board-ready reports, built from approved data
Report packs are generated from the same verified results as the dashboards, so the numbers always match. Schedule them, review them, and release them in either language.
Sample report pack
- PDFPDF
- PPTXPowerPoint
- DOCXWord
- XLSXExcel
- HTMLHTML
- 1ScheduleMonthly, quarterly or on demand
- 2GenerateCharts, heat maps and strategy maps from approved data
- 3NarrateAI drafts the commentary for a person to edit
- 4ApproveReviewed and signed off before release
- 5DistributeEmail, secure share link or download
- English, Arabic or both, with embedded fonts and right-to-left layout
- Your branding, templates and sections
- Secure share links that expire
- Every export recorded in the audit trail
Two languages, one platform
Every screen, workflow, notification and report works in English and in Arabic, with full right-to-left layout. Each user picks a language and can switch at any time.
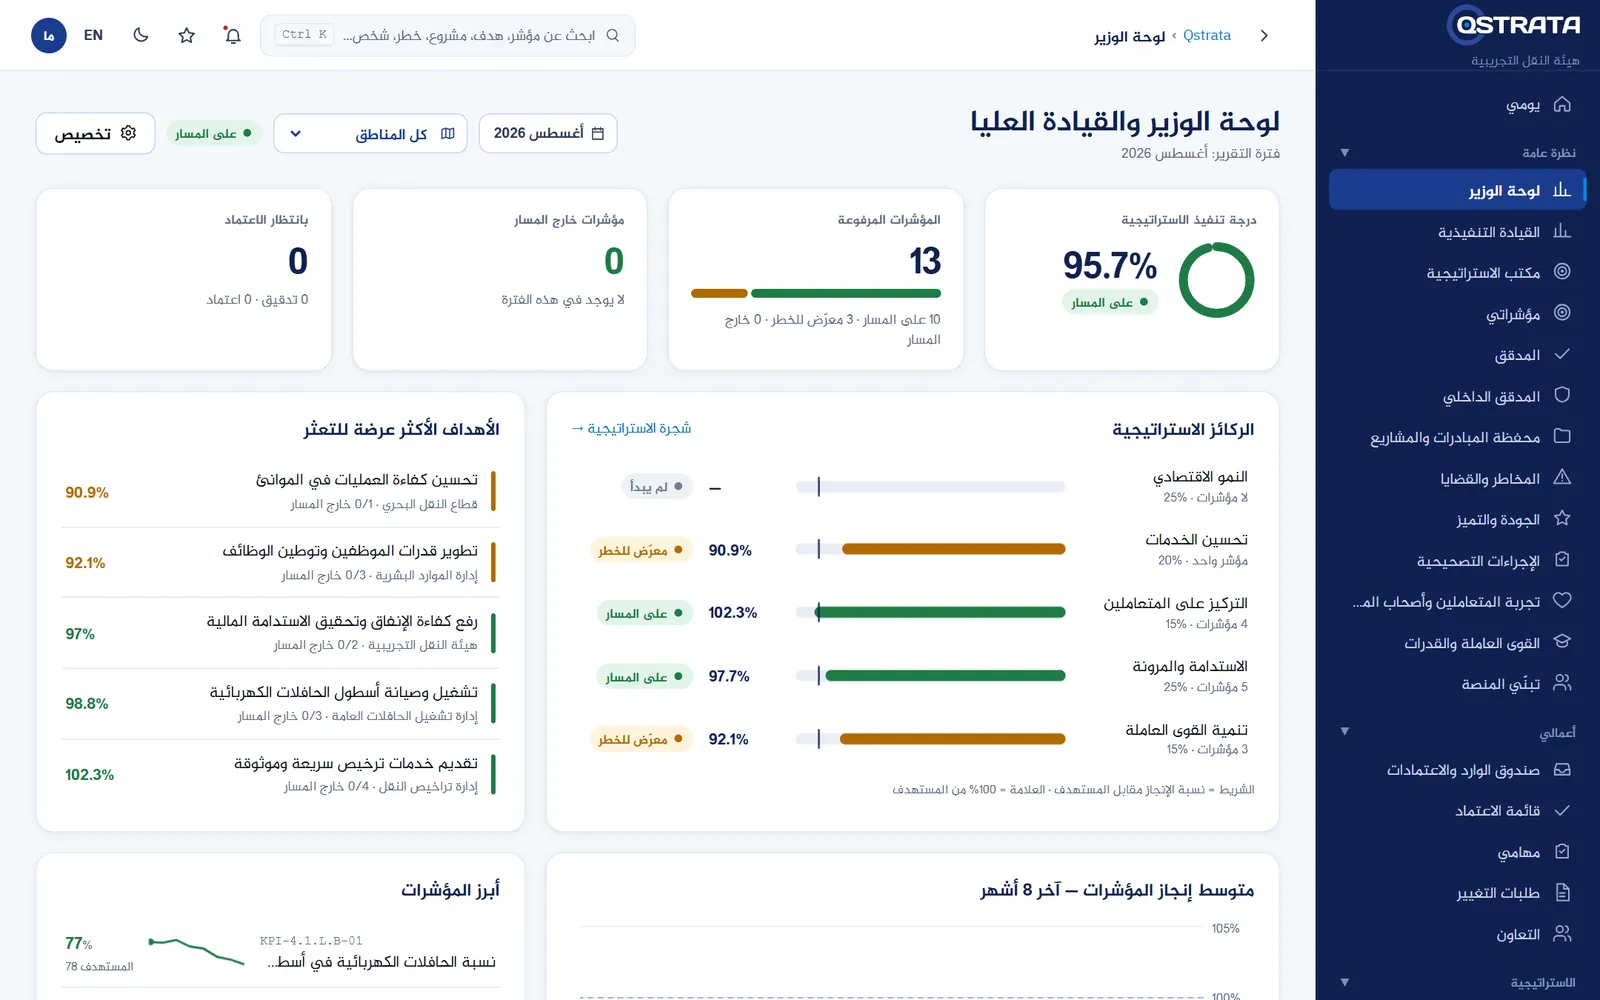
- Bilingual names and narratives on every record
- Arabic PDF and PowerPoint reports with embedded fonts
- Questions to the assistant in either language
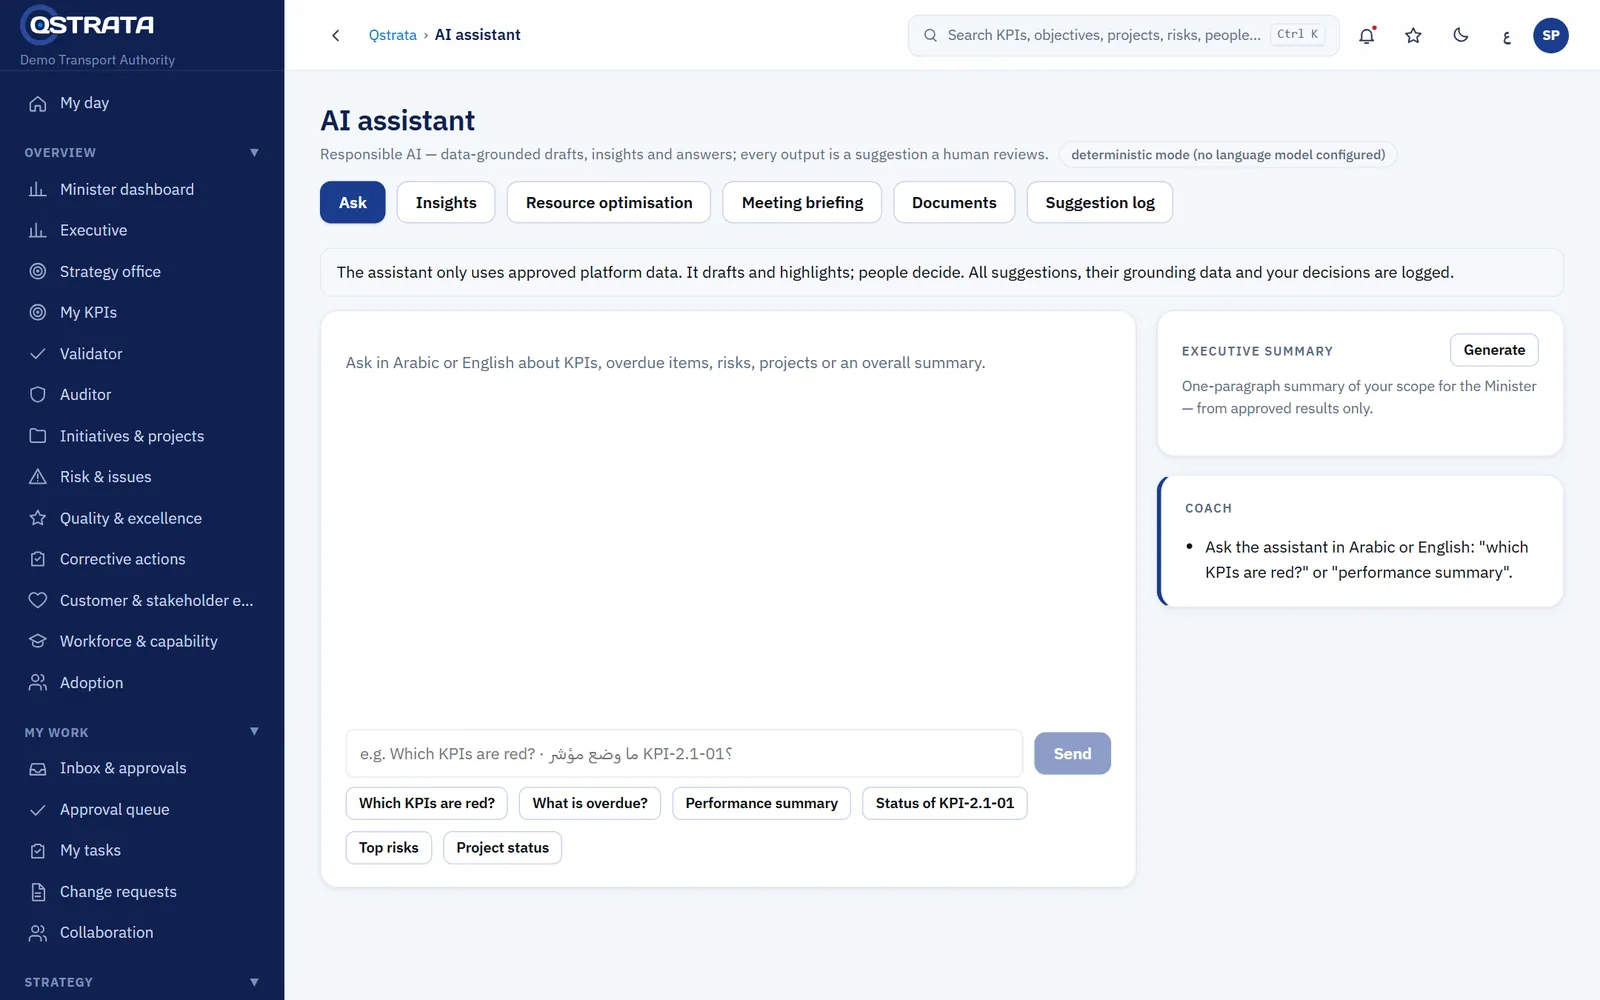
AI that assists and never decides
Qstrata's assistant saves your teams hours each cycle, under rules your organisation sets.
- Drafts objectives, KPIs, key results, targets, risks and report narratives
- Projects each KPI four to six weeks ahead and suggests interventions
- Detects anomalies and duplicate or unclear goals
- Answers questions in English or Arabic and shows its sources
- Prepares meeting briefings and quarterly review packs
- Every suggestion needs human approval, is logged, and can be limited by role or switched off
Works without any external AI service, or with the model provider you approve.
Connects to the systems you already run
- HR systems
- ERP
- CRM
- SQL Server and PostgreSQL
- SFTP file drops
- CSV and Excel import
- Jira
- Azure DevOps
- Microsoft Project
- Microsoft Teams
- Slack
- Outlook calendar
- BI tools via data feed
- Webhooks and REST API
Security your IT team will sign off
Qstrata runs where your data must stay and gives your security team the controls they expect.
Hosting you control
On-premise in your data centre, in a private or public cloud, on Docker or Kubernetes.
Single sign-on and MFA
SAML 2.0 and OpenID Connect, authenticator-app MFA, step-up verification for sensitive actions and idle time-outs.
Fine-grained access
Role, unit and attribute-based permissions, time-bound grants, classification-based redaction and database row-level security.
Encryption
AES-256 encryption of evidence and attachments at rest, protected key ring, TLS in transit.
Full audit trail
Append-only audit of every submission, approval, change and export, with SIEM export.
Privacy and retention
Personal-data export, anonymisation, retention and disposal rules.
Monitoring
Metrics, tracing and alerts with Prometheus, Grafana and OpenTelemetry.
No lock-in
Full export of your data in open formats at any time, plus a documented REST API.

Software, plus the team that makes it work
Qstrata is built and delivered by Brilyanz Consulting, a Doha firm that works on strategy, performance and people. We help you design your strategy and KPIs, move your data in, train every role, and stay with you through the first reporting cycles.
- Strategy and KPI design workshops
- Data migration and system integration
- English and Arabic training for every role
- Support through your first cycles
Questions
Is Qstrata only for government?
No. It suits any organisation that runs a strategy with KPIs or OKRs: ministries and authorities, semi-government and state-owned companies, and private groups.
Can we host it ourselves?
Yes. Qstrata can run in your own data centre, in a private cloud or as a hosted service. It ships as containers with Kubernetes manifests.
Do we have to use Arabic?
No. Each user chooses English or Arabic, and can switch at any time. Reports can be produced in either language or both.
How does it get our data?
Owners can enter results with evidence, or connectors can pull them from HR, ERP, CRM, databases, SFTP and project tools on a schedule.
Is the AI required?
No. AI features are optional, can be limited to certain roles or switched off, and every suggestion is reviewed by a person.
How long does it take to go live?
It depends on your scope. Brilyanz agrees a plan with you at the start, and you can begin with one unit and grow from there.
Request a demo
See Qstrata configured with sample data that looks like your organisation. We will contact you within two working days.